
A well-scoped mid-market automation pilot should show a defensible payback inside 12 to 18 months, provided the model runs on measured baselines rather than vendor projections. The single most important first step is capturing three numbers before you build anything: current time per transaction, monthly volume, and error rate. Everything else in the business case, from scenario ranges to break-even volume, gets built on top of that baseline.
TL;DR:
- A mid-market automation ROI should be based on measured baseline metrics, including current transaction times, volume, and error rates, before building the model.
- Realistic payback periods are typically 3 to 12 months for cost-reduction projects, with a three-year analysis window reducing the impact of slow initial adoption.
- Automation costs often underestimate initial spending by 30 to 50%, as they omit integration, change management, and internal resource expenses.
- Running multiple scenarios with adjusted adoption and risk factors is essential to demonstrate the business case’s resilience under different conditions.
- Weekly measurement during the first 90 days helps calibrate savings, with realistic expectations that actual benefits may be 20 to 40 percent lower than initial forecasts.
Table of Contents
- What is a realistic automation ROI for a mid-market business?
- Which benefits actually count as cash?
- What does automation actually cost, beyond the licence fee?
- How do you build conservative, base and optimistic scenarios?
- How should you design a pilot that proves the model?
- The gap between an automation forecast and an automation result
- How Oak & Nine turns your baseline into a funded roll-out
- Where to check your numbers before you present them
- Sources
- FAQ
What is a realistic automation ROI for a mid-market business?
Finance teams don't want a single confident number. They want to see how you arrived at it, and they want to see what happens if you're wrong.
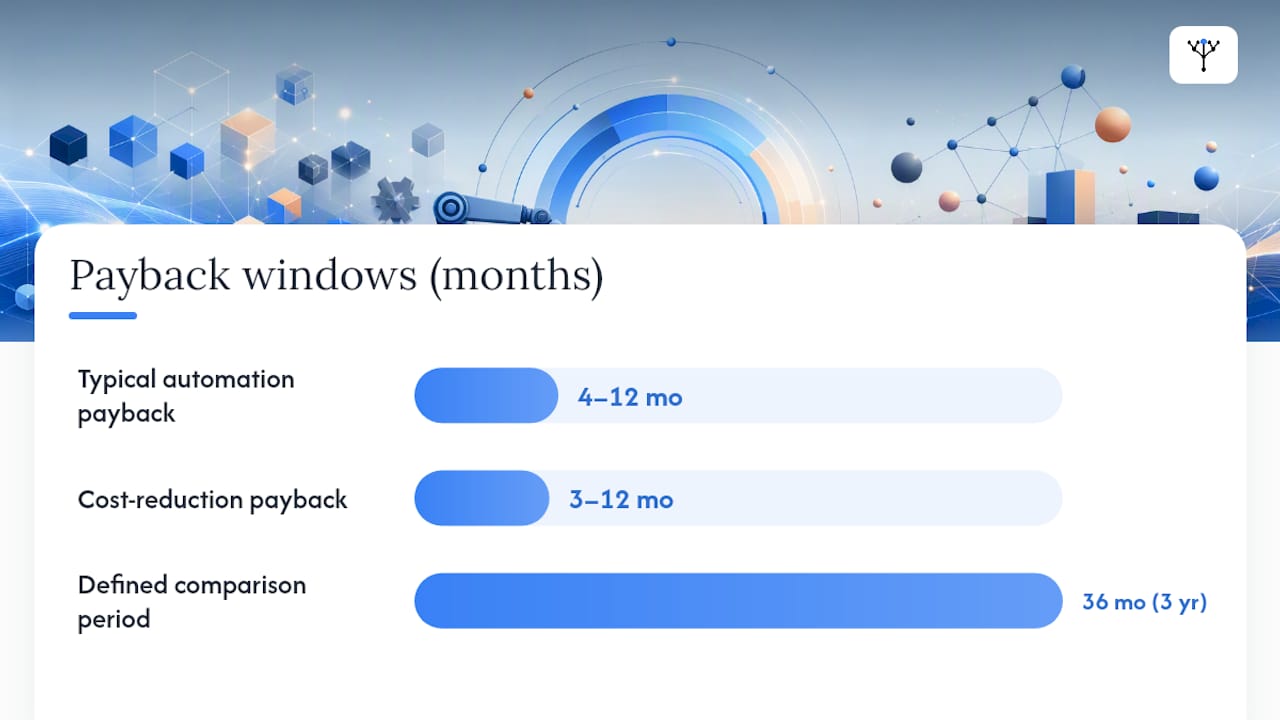
Well-scoped process automation projects commonly pay back in 4 to 12 months, with build cost and ongoing maintenance acting as the two levers that most often shift that window. A defined three-year comparison period is a defensible default for mid-market automation business cases, and payback for cost-reduction use cases often lands inside 3 to 12 months once integration and change management are properly counted.
Building the model itself is mechanical once you have the right inputs. Gather these before you touch a spreadsheet:
- Baseline volume of transactions per week or month
- Current time per transaction, measured, not estimated
- Fully-loaded hourly rate for the people doing the work
- Current error rate and the cost of correcting each error
- Licence fee, one-off build cost, and integration cost
- Change management and training spend
- Annual maintenance and internal owner time
The formula itself is simple: net benefit equals (labour hours saved × fully-loaded rate) plus error-correction savings, minus total annual cost. Divide total investment by annual net benefit to get payback in years. Run that across a three-year window because it's long enough to absorb a slow first quarter and short enough that a finance director can still hold you to it. The habit that separates a credible model from an optimistic guess is simple: measure the baseline before you build, never after.
Which benefits actually count as cash?
Not every improvement belongs on the same line of the business case. A model that treats "better visibility" the same way it treats "40 fewer hours of manual reconciliation" won't survive contact with a CFO.
Hard benefits are the ones a finance reviewer can trace to a specific line in the ledger:
- Labour cost avoided: hours saved multiplied by the fully-loaded hourly rate, not the headline salary
- Error-correction savings: error rate reduction multiplied by the fully documented cost of fixing each mistake
- Licence consolidation: retired tools and duplicate subscriptions, itemised individually
Pro Tip: Convert cycle-time gains into revenue carefully. If faster order processing lets you close deals two days sooner, quantify it as a conversion uplift on a known pipeline value, not a blanket "revenue increase" figure — finance will ask how you got there, and a vague answer undermines the whole model.
A robust ROI model keeps the majority of projected value in the hard, cashable category, with soft benefits, better decision speed, improved employee experience, reduced compliance risk, reported separately and weighted conservatively. Present them as upside, never as the number that justifies the spend. Our guide on the employee productivity formula walks through converting hours saved into a defensible financial figure line by line.
What does automation actually cost, beyond the licence fee?
The quoted vendor fee is rarely the number that determines whether your business case survives its first budget review. Most first-year cost estimates are undercounted by 30 to 50% because they leave out integration, change management, and the internal hours spent by people who already have full-time jobs.
Four cost buckets deserve a line each in your model:
- Implementation and build: scope, configuration, and testing, scaled to process complexity rather than a flat vendor quote
- Integration: connecting the automation to CRM, ERP, and HR systems, often the single largest source of underestimation
- Change management and training: typically a meaningful percentage of build cost, and routinely skipped by teams eager to hit a go-live date
- Ongoing maintenance: budgeted annually rather than treated as a one-off, since monitoring, rule updates, and internal ownership don't stop after launch
Guides on automation cost modelling suggest budgeting 15 to 25% of implementation cost each year for maintenance, with the higher end applying where integration complexity is greater. Skip this line and the savings you reported in year one will quietly erode by year two, with nobody able to say exactly why. Our workflow automation tools guide breaks down where technical complexity most often adds unplanned cost.
How do you build conservative, base and optimistic scenarios?
A single ROI figure invites exactly one question from finance: "What if you're wrong?" Three scenarios answer that question before it's asked.
- Set adoption and coverage assumptions per scenario. Conservative assumes slower rollout and partial process coverage; base reflects your realistic rollout plan; optimistic assumes faster adoption and full coverage.
- Apply explicit risk factors. Slower-than-planned adoption and unexpected integration complexity are the two variables that move actual results furthest from the model, so flex them independently rather than as one blended discount.
- Run sensitivity tests on coverage percentage, maintenance cost, and adoption speed, changing one variable at a time to see which one moves the outcome most.
- Calculate break-even volume: the transaction volume at which cumulative savings equal cumulative cost, which tells you whether the business case survives a slower quarter.
Pro Tip: Present all three scenarios side by side in the same table inside the business case, not as an appendix. Finance leaders consistently prefer a range over a single vendor-style estimate, and a visible downside case makes the optimistic one more believable, not less.
How should you design a pilot that proves the model?
Choose a high-volume, stable, rule-based process for the pilot. Judgment-heavy or exception-riddled workflows make poor test cases because they obscure whether the automation or the exceptions are driving the result.
Capture the baseline properly before go-live, using system timestamps, process mining, or a manual two-week tally if nothing else is available. Once live, measure weekly for the first 90 days, then shift to monthly reporting. Report throughput, error rate, adoption percentage, and actual hours saved against the projection every time.
Real-world savings routinely land 20 to 40% lower than the pre-build estimate until exceptions get resolved, so treat the first month as calibration, not verdict. Set kill or scale criteria before the pilot starts, tied to a specific coverage and adoption threshold, then feed the measured numbers straight back into the base-case scenario. That's how a pilot becomes evidence rather than theatre.
- Pick a high-frequency, rule-based process first
- Baseline via timestamps, process mining, or manual tally
- Weekly reporting for 90 days, then monthly
- Pre-agreed kill/scale thresholds before launch
The gap between an automation forecast and an automation result
Most automation business cases fail not because the maths is wrong, but because the maths was never checked against reality. Nobody planned for that gap, so it reads as failure rather than the normal calibration every automation programme goes through.
At Oak & Nine, we treat the pilot as the model's proof, not its afterthought. Because integrated platforms connect data from HR, finance, and operations in one live view, it is possible to run phased pilots against real system data rather than assumed baselines, and adjust scenarios as adoption numbers come in. Before we'll back a business case, we ask for the same three things every time: documented baseline metrics, a measurement cadence agreed in advance, and a clear plan for who owns adoption once the pilot ends.
— Ronan
How Oak & Nine turns your baseline into a funded roll-out
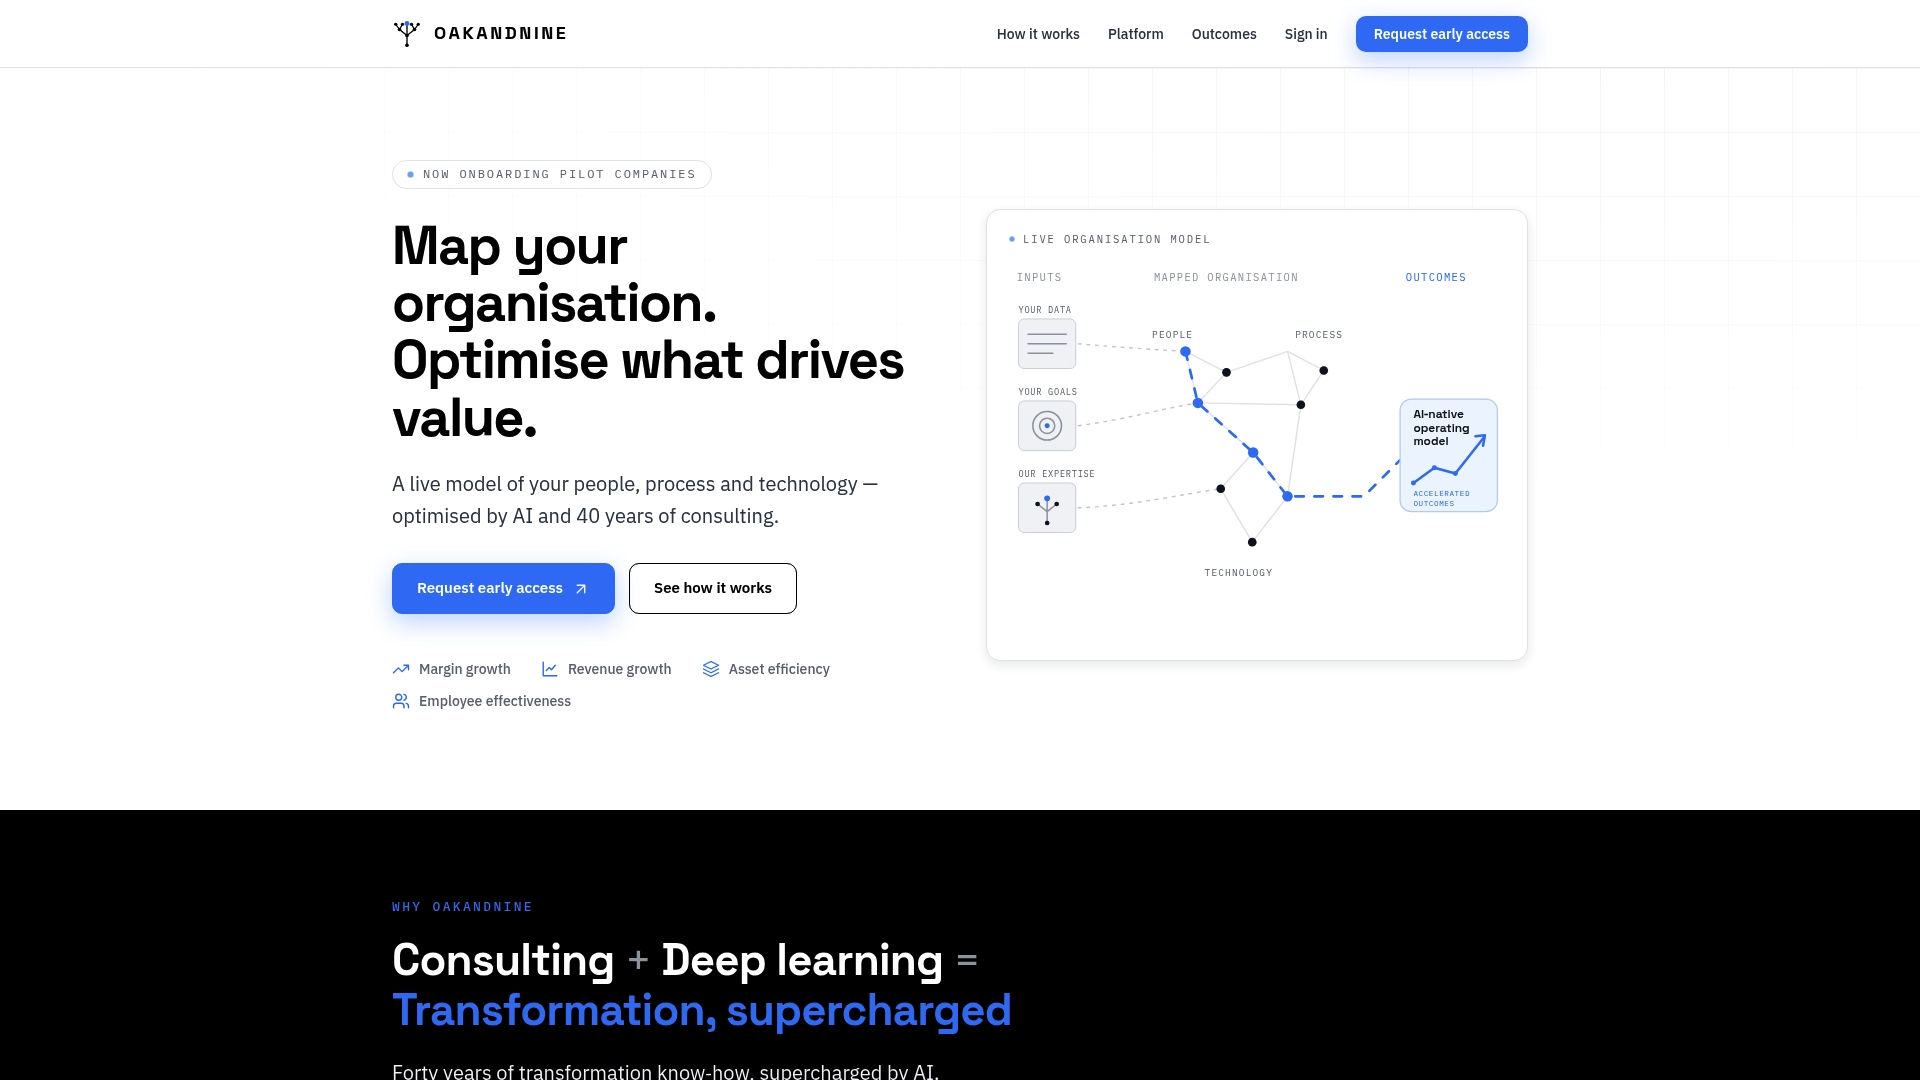
If you've followed this playbook this far, you already have the hardest part done: a defensible model and the discipline to test it. Some platforms are designed to give leaders a live, connected view of the processes, systems, and people the pilot touches, so the baseline captured early stays visible and auditable through every measurement cycle.
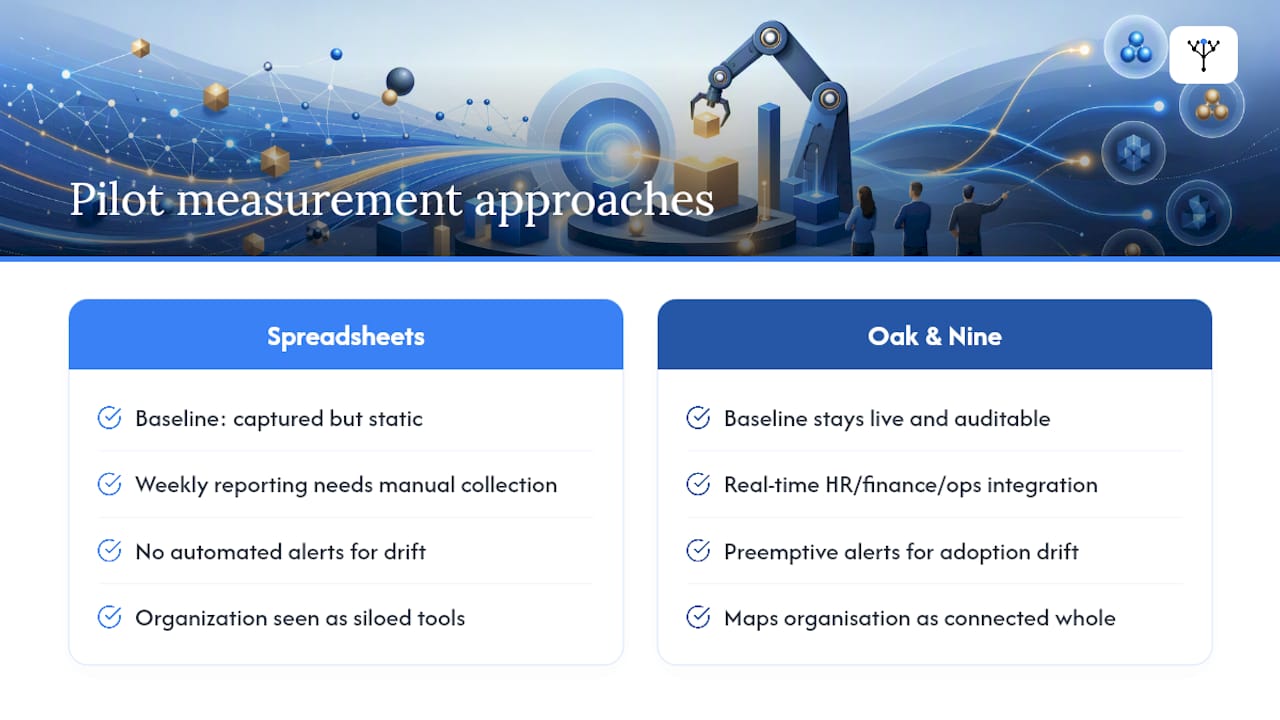
Real-time integration linking HR, finance, and operations data automatically can reduce the need for manual data collection from separate systems during weekly pilot reporting. Preemptive alerts flag when adoption or error rates drift from the scenario you modelled, before that drift shows up as a disappointing quarterly review. Platforms that map the organisation as a connected whole rather than a set of siloed tools can provide governance support for scaling a successful pilot into a full roll-out as an integrated feature rather than an add-on.
If you're an operations leader ready to move from spreadsheet model to measured pilot, Oak & Nine's operations-focused offering is the natural next step, and it's worth a direct conversation about running an ROI workshop against your own baseline data.
Where to check your numbers before you present them
A handful of external resources are worth running your model against before it reaches a finance committee.
- The Phoenix AI Solutions mid-market ROI guide benchmarks typical payback windows for cost-reduction automations.
- Progressive Robot's ROI calculator guide sets out the seven inputs most models miss.
- Techsy's process automation calculator offers worked examples of build cost and maintenance banding.
- Ahead of Sales's ROI toolkit is a useful cross-check for translating cycle-time gains into revenue figures.
Sources
- Mid-Market AI Implementation ROI: How to Calculate, Model & Justify Investment in 2026 - Phoenix AI Solutions
- Automation ROI Calculator: 7 Proven Steps to Smart Savings
- Process Automation ROI Calculator; Techsy
- Business Process Automation: Complete ROI Framework
FAQ
What is a good ROI timeline for automation projects?
Well-scoped, cost-reduction automation projects at mid-market companies typically show payback inside 3 to 12 months, with a three-year window used as the standard comparison period for the full business case.
What inputs does a credible automation ROI model need?
You need baseline transaction volume, time per transaction, fully-loaded hourly rate, current error rate, and the full cost picture: licence fee, build, integration, change management, and annual maintenance.
How much should I budget for ongoing maintenance?
Guides on automation cost modelling suggest 15 to 25% of implementation cost annually, with the higher end applying to projects with heavier integration complexity.
Why do pilot results often come in lower than the forecast?
Real-world savings are routinely 20 to 40% lower than pre-build estimates until process exceptions get resolved, which is why weekly measurement in the first 90 days matters more than the original projection.
How can Oak & Nine support an automation business case?
Oak & Nine connects HR, finance, and operations data into one live view, so pilot baselines, adoption rates, and error reductions stay measurable and auditable throughout the roll-out rather than reconstructed after the fact.