
A driver tree is a one-page arithmetic map that links operational levers—price, volume, conversion, unit cost—to a single financial outcome. It exists to diagnose variance and power driver-based forecasts, not to decorate a board pack. FP&A teams, operations leaders, and managers who need to know which lever to pull, and by how much, are the natural users.
TL;DR:
- Most driver trees should include five to ten drivers to balance comprehensiveness with usability, avoiding overcomplication that hampers actionability.
- Validation of relationships requires checking historical data and confirming a clear business rationale, especially to prevent misattributing causality from seasonal patterns.
- Builder focus should be on actionable, arithmetic first-level drivers with clear ownership, stopping at nodes influenced directly by a person to keep the tree manageable.
- Regular updates, named owners, and automated alerts are essential to maintain a live driver tree that continuously supports decision-making.
- Pilot projects should start with a single P&L line, such as revenue or gross margin, before expanding to connected, automated models that drive operational insights.
Table of Contents
- What driver tree analysis actually shows you
- Nodes, edges, and where to stop decomposing
- How to build a driver tree for forecasting
- Revenue, profit and cost trees in practice
- Validating your tree and avoiding the usual traps
- Turning a static tree into a live operating model
- Why driver trees deserve a permanent place in the toolkit
- Running a live driver tree with Oak & Nine
- Sources
- FAQ
What driver tree analysis actually shows you
A driver tree separates two kinds of relationship, and confusing them is where most models fail. The first is mathematical decomposition: revenue equals price multiplied by quantity, profit equals revenue minus cost. These branches close exactly, because a driver tree decomposes a financial outcome into the operational drivers that create it using arithmetic and causal links, so the decomposition closes when children recombine into the parent. The second is looser causal reasoning, such as "marketing spend drives conversion rate." That link is real but probabilistic, and a well-built tree marks it as such rather than pretending it is arithmetic.
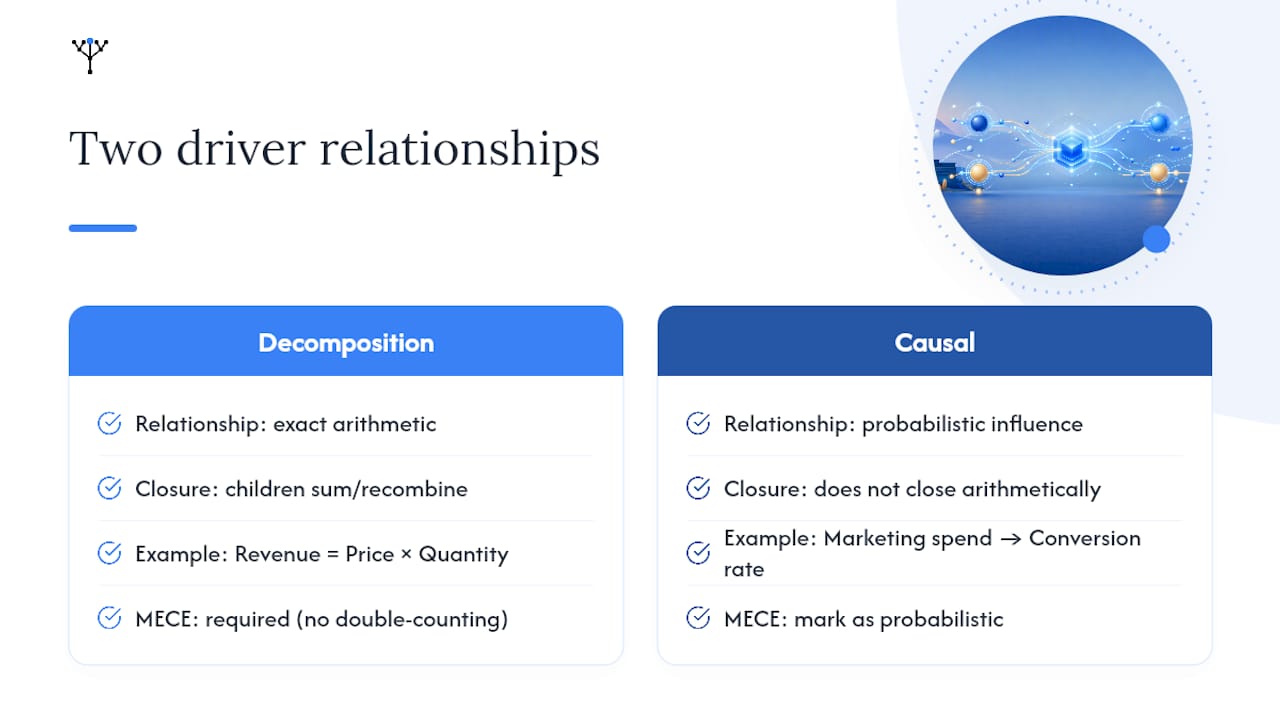
This is where MECE (mutually exclusive, collectively exhaustive) earns its keep. Every child node should account for a distinct slice of its parent, with no gaps and no double-counting. Skip that discipline and the tree stops being diagnostic. It becomes a wish list.
Driver trees sit at the intersection of three workflows: explaining last month's variance, building next quarter's forecast, and stress-testing scenarios before a board meeting. The same structure serves all three, because the same drivers that explain past variance also serve as forecast inputs, which is the real efficiency gain over building separate models for each purpose.
Nodes, edges, and where to stop decomposing
Every driver tree has a root metric (revenue, gross margin, EBITDA) and a first tier of drivers that multiply or sum to produce it. Below that sit terminal levers: the nodes small enough that a named person can actually move them.
Depth is a judgement call, not a rule. Consulting practice suggests three to four levels for a compact analysis, deeper only where the extra granularity changes a decision. Structuring nodes well means covering a few consistent points:
- The root metric is singular. Two outcomes need two trees, not one with a split trunk.
- First-level drivers are arithmetic where possible, price times volume, not vague categories like "market factors."
- Terminal levers stop where ownership starts. If nobody can influence a node directly, decompose it further or drop it.
- Somewhere between five and ten drivers usually explains most of what moves the number, which keeps the tree usable rather than encyclopaedic.
- Each node gets one accountable owner, ideally mapped through something like a decision rights matrix so authority and analysis line up.
How to build a driver tree for forecasting
Building a usable tree is a sequence, not a brainstorm. Skip a step and the model either won't validate or won't get used.
- Define the outcome and horizon. Pick one metric, revenue, contribution margin, cash conversion, and one time horizon. Monthly forecasting needs a different tree shape than annual planning.
- Map first-level arithmetic drivers. Write the equation that produces the root metric exactly. Revenue as customers times average order value times purchase frequency is a common starting shape.
- Decompose to actionable levers and pull baseline data. Push each branch down until you hit something a manager can influence this quarter, then gather twelve to twenty-four months of history for each node.
- Quantify sensitivity. Calculate how a 1% move in each driver shifts the root metric, then rank drivers by that leverage. This single step turns a diagram into a diagnostic tool, because it tells you where effort actually pays off rather than where it feels productive.
- Validate every edge. Check parent-child relationships against historical data and confirm there's a real business mechanism behind the correlation, not just a coincidence in the numbers.
- Assign owners and set alerts. Every node needs one named owner and a trigger that notifies them when their driver moves outside a normal range.
Pro Tip: You don't need specialist software to start. A driver tree can be built in a spreadsheet during a single workshop for the top P&L lines; tooling matters for scaling and keeping the model live, not for proving the concept.
Revenue, profit and cost trees in practice
The clearest way to understand a driver tree is to watch one trace a real shortfall back to its cause.
- Revenue tree: customers × purchases per customer × average order value. Splitting the trunk this way immediately tells you whether a revenue miss is a traffic problem, a retention problem, or a basket-size problem, three entirely different fixes.
- Profit tree: revenue minus cost, with revenue split as above and cost split into volume-driven cost and unit cost. A margin squeeze that looks identical at the P&L level can originate from either branch, and the fix for each is unrelated to the other.
- Worked trace: a £120,000 monthly revenue shortfall decomposes into customers (on target), purchases per customer (down 8%), and average order value (on target). The owner of purchase frequency, typically a retention or customer success lead, gets the alert and the action item, not the whole commercial team guessing at once.
The same structure feeds scenario planning. That's the practical link between operations KPIs and a forecast leadership actually trusts.
Validating your tree and avoiding the usual traps
A correlation between two nodes is a starting point, never proof. Validating a parent-child relationship means checking historical data and confirming a business rationale, because a high correlation is necessary but not sufficient to establish causation. Seasonality is the classic trap here: a driver that appears to move the outcome in Q4 might simply share a seasonal pattern with it, with no causal link at all. Check the relationship across several periods before you trust it.
Complexity is the second trap. Common failure modes are drivers that don't reflect real causality, excessive granularity, and no named owner, and the fix for all three is validation, focus on actionable levers, and explicit ownership. A handful of well-chosen points to keep front of mind:
- Start with five to ten drivers; most trees explaining most of their variance stop there.
- Re-test edges when the business model changes, a pricing shift or new channel can silently break an old relationship.
- Never let a node exist without an owner attached, otherwise it's a chart, not a management tool.
Pro Tip: If a driver hasn't moved the outcome in any of the last four quarters, question whether it belongs in the tree at all. Dead branches make live ones harder to see.
Turning a static tree into a live operating model
Most driver trees die in a slide deck within a quarter of being built. They go stale because nobody updates the inputs, nobody owns the nodes, and nobody gets told when a driver moves. A live tree fixes all three by wiring in real data, named accountability, and alerts, which is what separates a static deliverable from an operating model.
The rollout path doesn't need to be ambitious on day one:
- Pilot in a spreadsheet on one P&L line, revenue or gross margin is usually the right starting point.
- Automate the data feed once the structure is proven, manual refresh is the first thing that kills adoption.
- Assign owners and connect alerts so a driver moving outside range triggers a person, not a quarterly review.
- Track whether the action taken actually moved the driver and the parent metric, closing the loop is the hardest and most neglected part of this work.
| Stage | What it needs | What it delivers |
|---|---|---|
| Pilot | Spreadsheet, one metric, one workshop | Proof the structure holds |
| Connect | Automated data links | Current numbers, not last month's |
| Operate | Named owners, alerts | Action before the number drifts further |
This is precisely the gap that connected platforms aim to close, unifying data across functions so a driver's movement surfaces to its owner automatically, rather than waiting for the next reporting cycle.
Why driver trees deserve a permanent place in the toolkit
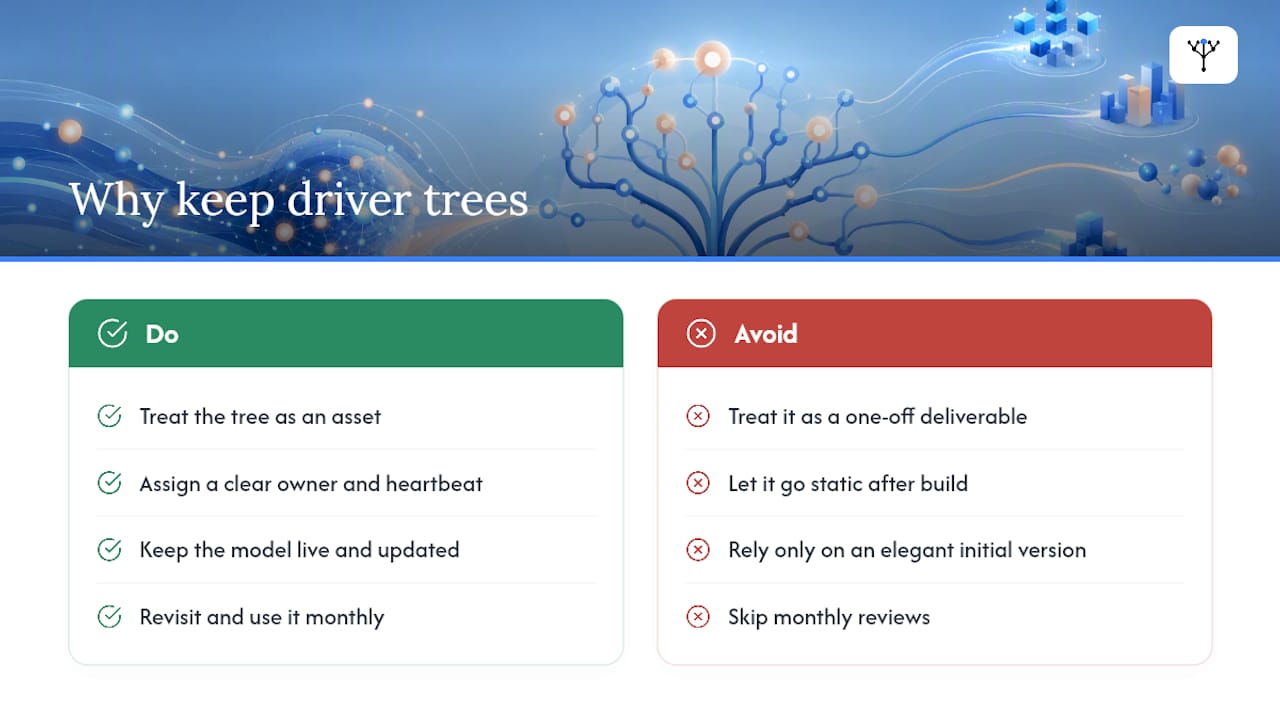
Mid-market companies rarely lack analysis. They lack analysis that survives contact with a busy quarter. A driver tree, built properly and kept live, is one of the few tools that scales down to a single spreadsheet pilot and up to a fully connected operating model without changing its underlying logic.
Treat it as an asset with an owner and a heartbeat, not a one-off deliverable for a planning cycle. The teams that get real value from this method are the ones who revisit the tree monthly, not the ones who built the most elegant version once.
— Ronan
Running a live driver tree with Oak & Nine
Oak & Nine replaces the spreadsheet-and-email version of driver tree management with a connected system: your organisational data flows into one model instead of sitting in disconnected files that someone has to chase every month.

Real-time insights from such platforms can surface a driver's movement to its assigned owner before it becomes next quarter's board question, and cross-functional data unification means the revenue, cost, and operational branches of a driver tree draw from the same live numbers rather than separate exports. For managing directors juggling a full P&L view, that single connected picture, covered in more depth on the Oak & Nine page for managing directors, removes the reconciliation work that usually eats the first week of every forecasting cycle.
A sensible starting point: pilot one P&L line, revenue or margin, assign an owner to each driver node, connect the underlying data, and track whether the resulting actions actually move the number. If that pilot proves the case, book a look at how Oak & Nine connects the functions behind your own driver tree.
Sources
- Building driver trees for forecasting — AccountancyCapital
- Driver-Based Performance Analysis — Onetribe Advisory
FAQ
What is driver analysis?
Driver analysis identifies which underlying factors, price, volume, conversion, cost, cause movement in a business outcome, then quantifies how much each factor contributes. A driver tree is the visual, arithmetic structure most commonly used to run this analysis.
What are the five steps of decision tree analysis?
For a driver tree specifically, the working sequence is: define the outcome and horizon, map first-level arithmetic drivers, decompose to actionable levers, quantify sensitivity, and validate each relationship before assigning owners.
What are the key revenue drivers?
Revenue typically decomposes into customer count, purchase frequency, average order value, and, in more granular trees, conversion rate and channel mix. The right split depends on the business model, but these four cover most cases.
What is a value driver tree in SAP Analytics Cloud?
Within SAP Analytics Cloud, a value driver tree is a modelling feature that lets planners build the same kind of hierarchical, formula-based structure described here, linking operational inputs to a financial output for live forecasting and simulation. The underlying logic, arithmetic decomposition validated against real data, is identical to any well-built driver tree, regardless of the software used to run it.
How many drivers should a driver tree have?
Most effective trees use a moderate number of drivers, as this balance typically explains most of the variance in the outcome metric without becoming too complex to maintain or act on.