
Operational efficiency is defined as the ability to deliver outputs at lower cost, faster cycle times, and higher quality by removing waste from your core processes. Organizations that apply structured process mapping combined with targeted automation achieve 15–30% cost reductions and 40–60% cycle time improvements within 8–16 weeks. That is not a theoretical ceiling. It is a 2026 industry benchmark, and mid-market companies are hitting it. The standard industry term for this discipline is operational excellence, and it covers the full system of people, processes, and technology working in alignment. This guide gives you the exact steps to get there.
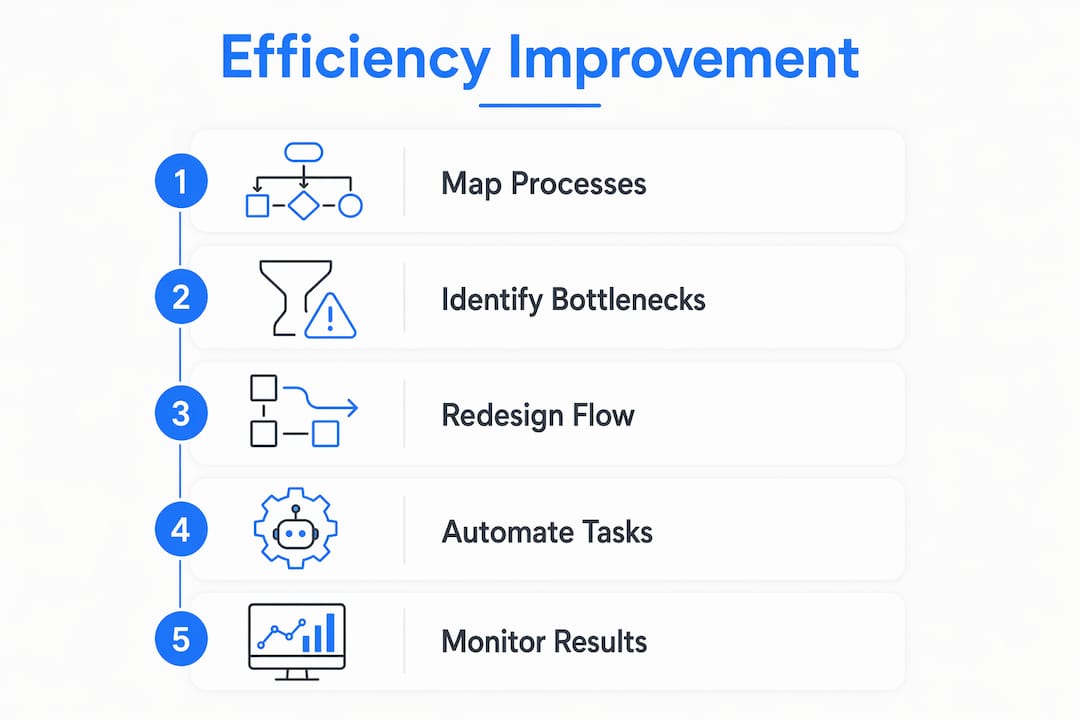
How to improve operational efficiency: what you need before you start
The most common reason improvement programs stall is not a lack of tools. It is a lack of prerequisites. Before you map a single process, you need three things in place.
Executive sponsorship at VP level or above. Process improvement crosses departmental lines. Without someone who can resolve turf disputes and authorize resource allocation, your program will die in committee.
A defined scope of 3–5 core processes. Trying to fix everything at once produces nothing. Pick the processes that drive the most cost, the most customer-facing errors, or the longest cycle times. These are your targets.
Baseline data. You cannot measure improvement without a starting point. Collect cycle time, error rate, throughput, and cost per transaction for each target process before you change anything.
The right tools matter too. For process mapping, BPMN (Business Process Model and Notation) is the recognized standard. It gives your maps a consistent visual language that any operations professional can read. For automation, the choice depends on task type: rule-based repetitive tasks suit robotic process automation (RPA) platforms, while more complex decision logic calls for workflow orchestration tools.
Industry benchmarks for the Operational Efficiency Ratio vary significantly by sector:
| Sector | Operational Efficiency Ratio |
|---|---|
| Technology | 30–60% |
| Services | 20–45% |
| Manufacturing | 15–35% |
| Retail | 10–25% |
Knowing your sector benchmark tells you whether you are underperforming or already near the ceiling. It also sets a credible target for your executive sponsor to present to the board.
How to map current processes and find real bottlenecks
The single most important step in any improvement program is mapping how your processes actually run, not how the procedure manual says they should run. Real-world process mapping uncovers hidden waste from manual escalations, informal workarounds, and undocumented approval loops that standard documentation never captures.

Use BPMN or structured flowchart notation with swim lanes. Each swim lane represents one team or role. This format makes handoffs visible, and handoffs are where most delays live.
Measure these four metrics across a minimum of two weeks of live data:
- Cycle time: total elapsed time from process start to completion
- Throughput: number of cases completed per unit of time
- Error rate: percentage of cases requiring rework or correction
- Wait time: time spent idle between process steps
Pro Tip: Record the informal workarounds your team uses daily. These are not signs of failure. They are diagnostic signals pointing directly at your real bottlenecks.
Once you have the data, classify each bottleneck by type: resource constraints (not enough people or capacity), dependency delays (waiting on another team), or decision bottlenecks (approvals that require senior sign-off). Then plot each bottleneck on an impact vs. effort matrix. High impact, low effort fixes go first. This is how you generate early wins that build organizational momentum.
What redesign strategies deliver quick wins and lasting gains?
Lean methodology gives you the clearest framework for removing waste before you touch automation. Lean identifies seven waste categories: overproduction, waiting, transport, over-processing, inventory, motion, and defects. Each one has a direct operational equivalent in a service or administrative process.
Quick wins come from three areas:
- Approval consolidation. Replace sequential approval chains with parallel sign-offs where possible. A five-step sequential approval that takes three days can often become a two-step parallel approval that takes four hours.
- Form standardization. Inconsistent input formats create downstream rework. Standardizing intake forms for your top three processes typically cuts error rates by a measurable margin within weeks.
- Redundancy removal. Audit every data entry step. If the same information is entered more than once across a process, that is pure waste. Eliminate it.
For deeper bottlenecks, redesign the process flow itself before considering automation. Reduce handoffs by assigning end-to-end ownership to a single role where feasible. Parallelize steps that do not have a true dependency. Then pilot the redesigned process with a small cohort before rolling it out. A two-week pilot gives you enough cycle data to validate whether cycle time has actually dropped.
Pro Tip: Never automate a broken process. Automation at speed amplifies existing errors. Fix the process design first, then automate the clean version.
How to deploy and monitor automation for sustainable gains
Automation works best on tasks that meet four criteria: they are stable and well-defined, they are performed manually at high volume, they follow consistent rules, and they do not require contextual judgment. If a task fails any of these criteria, it is not ready for automation.
The most common automation failure mode is deploying without a fallback. Automation requires manual fallback processes and live execution monitoring from day one. When an automated workflow hits an edge case it was not designed for, it needs to route cleanly to a human handler, not fail silently.
Build your monitoring framework around four KPIs from the moment you go live:
- Cycle time vs. baseline: is the automated process faster than the manual version?
- Error rate vs. baseline: is automation producing fewer errors, or just different ones?
- Throughput: is volume being processed as expected?
- Exception rate: what percentage of cases are falling through to manual handling?
Automation ROI must exceed 3:1 over 12 months to justify deployment costs. Calculate this before you build, not after. If the math does not work at 3:1, the process is either too low volume or too complex for automation at this stage.
Assign a named process owner to each automated workflow. This person reviews the exception log weekly, flags degradation in KPIs, and owns the continuous improvement cycle. Without this accountability, automated processes drift and degrade over months.
| Automation KPI | Target threshold |
|---|---|
| Cycle time reduction | 40–60% vs. manual baseline |
| Error rate reduction | Measurable decrease within 4 weeks |
| Exception rate | Below 10% of total volume |
| ROI over 12 months | 3:1 minimum |
How can AI-powered tools accelerate operational efficiency improvements?
AI changes the economics of process improvement in one specific and measurable way. AI-powered process mapping tools reduce documentation time by up to 90% by converting standard operating procedures directly into BPMN-compliant process maps. A mapping exercise that previously took a consultant two weeks now takes two days.
Beyond documentation, AI adds value in three operational areas:
- Anomaly detection: AI monitors live process data and flags deviations from expected patterns before they become failures.
- Predictive bottleneck identification: by analyzing historical throughput data, AI can predict where capacity constraints will emerge before they cause delays.
- Routine task automation: AI agents handle high-volume, low-complexity tasks such as data classification, document routing, and status updates without human intervention.
The critical discipline is separation. Operational impact is strongest when you clearly distinguish between low-complexity, high-volume tasks suited for AI automation and high-judgment tasks that require human decision-making. Mixing these categories produces brittle workflows and frustrated teams.
Start every AI pilot with a single, measurable bottleneck. Define the KPI you expect to move, set a time boundary, and evaluate against that benchmark. AI pilots with focused workflows and clear business KPIs consistently outperform broad, organization-wide deployments.
The organizations seeing the strongest results from AI are not the ones with the most ambitious AI strategies. They are the ones with the most disciplined scoping.
Key Takeaways
Operational efficiency improves most reliably when you map actual process flows, remove waste before automating, and assign named owners to every improvement initiative.
| Point | Details |
|---|---|
| Map actual processes | Document how work really runs, not the idealized version, to find hidden waste. |
| Set baselines first | Measure cycle time, error rate, and throughput before making any changes. |
| Fix before automating | Redesign broken process flows before deploying automation to avoid amplifying errors. |
| Monitor automation rigorously | Track exception rates and KPIs from day one; assign a named process owner to each workflow. |
| Scope AI pilots tightly | Start with one measurable bottleneck and a clear KPI before expanding AI deployment. |
What I have learned about sustaining operational gains
The programs that produce lasting results share one characteristic: they build cumulative capabilities rather than isolated fixes. Companies that implement fragmented short-term fixes using Lean or Six Sigma often fail to improve market share because each fix operates in isolation. The gains evaporate when attention moves elsewhere.
What actually sustains improvement is culture, and culture requires ownership. Operational excellence demands empowered champions who have genuine authority to drive change, not people who were handed the role as an afterthought. I have seen well-funded improvement programs collapse because the designated champion had no real authority and no personal stake in the outcome.
The measurement cadence matters as much as the initial measurement. Teams that review their process KPIs monthly maintain gains. Teams that review them quarterly lose them. The discipline of regular measurement is what separates a one-off project from a genuine operating model shift.
My honest view is that most mid-market organizations underinvest in the cultural side of operational improvement and overinvest in the technology side. The tools are the easy part. Getting a leadership team to hold itself accountable to a process KPI every month is the hard part. That is where the real work lives.
— Ronan
Oakandnine's approach to operational efficiency
Operational efficiency improvement requires a clear picture of how your people, processes, and technology interact today before you can redesign for tomorrow. Oakandnine builds that picture through a live operating model that integrates all three dimensions, powered by AI and backed by four decades of consulting experience.
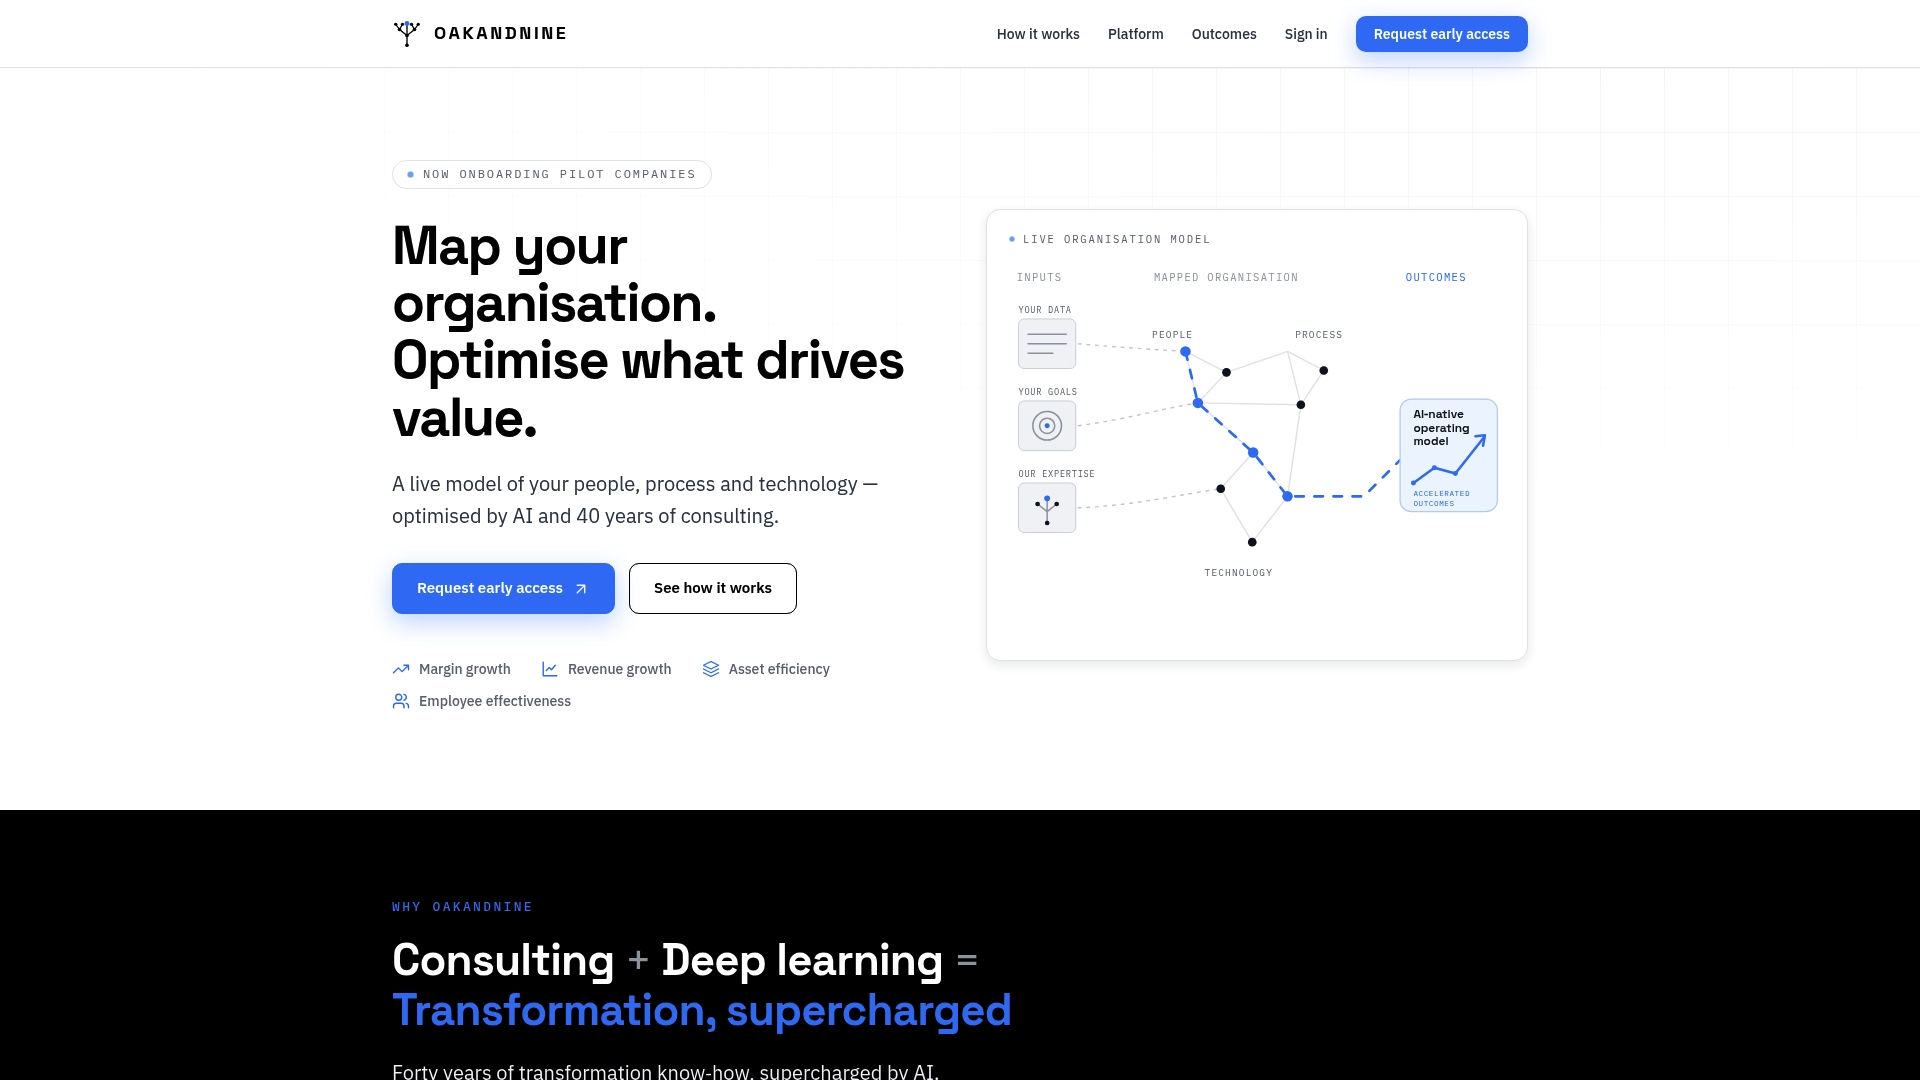
Oakandnine converts scattered operational data into a coherent model of how your organization actually functions. From there, friction points become visible, improvement priorities become clear, and the path to measurable margin growth becomes concrete. If you are ready to move from diagnosis to action, explore Oakandnine's platform and see how mid-market leaders are turning process mapping into performance gains.
FAQ
What does operational efficiency mean in practice?
Operational efficiency means delivering the same or better output at lower cost and faster cycle times by removing waste from core processes. The standard measurement tool is the Operational Efficiency Ratio, which benchmarks vary by sector from 10–60%.
How long does it take to see results from process improvement?
Organizations applying structured process mapping and automation see measurable results within 8–16 weeks, including 15–30% cost reductions and 40–60% cycle time improvements.
What is the biggest mistake companies make when automating processes?
The most common failure is automating a broken process. Fix the process design first, then automate. Deploying automation without manual fallback processes and live monitoring also leads to silent failures that are difficult to diagnose.
How does AI differ from standard automation in operations?
Standard automation executes fixed rules on stable, repetitive tasks. AI adds anomaly detection, predictive analysis, and adaptive decision-making. The key is separating low-complexity tasks for AI automation from high-judgment work that requires human oversight.
What role does leadership play in operational efficiency programs?
Executive sponsorship at VP level or above is a prerequisite, not a nice-to-have. Empowered internal champions with real authority to drive change are what separate programs that sustain gains from those that fade after the initial project closes.