
Organisational mapping is a visual, capability-linked view of who does what and how work flows across a company. It reveals ownership gaps and hidden collaboration bottlenecks that block strategy long before they show up in a missed target. Operations leaders, HR heads, and managing directors typically own the exercise, and the payoff is straightforward: faster decisions, clearer accountability, and fewer surprises when the business tries to change.
TL;DR:
- Organisational mapping reveals capability ownership, process flows, and information exchanges, providing a diagnostic view beyond traditional reporting lines.
- It highlights unowned or shared capabilities, workflow bottlenecks, and informal decision networks that impact strategy implementation.
- The process is most valuable during restructures, acquisitions, or digital transformations, especially when complexity causes internal friction.
- Continuous, live mapping systems like Oak & Nine enable real-time updates, identifying gaps and bottlenecks before they escalate into costly issues.
- Using structured data and participatory tools ensures maps reflect current reality, avoiding rapid obsolescence typical of static diagrams.
Table of Contents
- What organisational mapping actually shows you
- What every useful organisational map needs to capture
- How do you run an organisational mapping exercise?
- How do you read an organisational network map?
- When should you use organisational mapping?
- Which templates and facilitator methods are worth using?
- Why static organisational maps stop working
- How Oak & Nine keeps your organisational map current
- Sources
What organisational mapping actually shows you
An org chart tells you who reports to whom. Organisational mapping tells you something more useful: whether the capabilities your strategy depends on actually have an owner, a working process, and the information they need to function. That distinction is what separates a static reporting diagram from a genuine bridge between strategy and structure.
The technique borrows heavily from business architecture. In enterprise architecture frameworks such as TOGAF, a capability map shows what the business does, while an organisation map shows which units actually hold or use those capabilities. Put the two together and you get a diagnostic tool rather than a static graphic.
Done properly, organisational mapping delivers outcomes an org chart never touches:
- Clear accountability for capabilities that currently have no obvious owner
- A prioritised view of where investment or restructuring will have the most impact
- Better change readiness, because leaders can see dependencies before they announce a reorg
- A shared reference point that finance, HR, and operations can all read the same way
None of this requires exotic software. It requires structured data and a willingness to look at the business as a set of connected functions rather than a family tree.
What every useful organisational map needs to capture
A map that only shows reporting lines will mislead you. The components below are what turn a diagram into an analytical tool, and skipping any one of them tends to produce blind spots later.
- Structure and capabilities. Map each business capability against the unit or team that owns it, not just the department it sits under.
- Processes and value streams. Show how work actually moves from one function to the next, including the handoffs that slow it down.
- Information flows and external partners. Vendors, contractors, and key partners belong on the map because they shape how work actually gets done, a point often missed by tools built only for internal reporting lines, as OrgNet's mapping guidance makes clear.
- Roles, decision rights, and informal networks. Formal titles rarely match who actually makes decisions day to day.
Pro Tip: Before you map anything, list every capability your strategy depends on for the next 12 months. Any capability with no clear owner on paper is exactly the gap the map needs to surface.
How do you run an organisational mapping exercise?
You can move from a blank page to a usable map in one quarter if you follow a disciplined sequence. This is the same logic behind the four-step method that links strategy directly to structural change, and it works whether you're mapping a 40-person department or a 4,000-person division.
- Define strategic focus and target capabilities. Start with what the business needs to be able to do in the next 12 to 18 months, not what it currently does.
- Map current capabilities against structure. Overlay today's teams and roles onto that capability list to see where ownership is clear, shared, or missing entirely.
- Collect interaction data and run a gap analysis. Surveys, workshop input, and system data show where handoffs break down and where capabilities sit with nobody accountable.
- Design the target state, assign owners, and plan short runs. Rather than a single big-bang reorganisation, break the redesign into short, testable phases with named owners for each capability.
A single facilitator can usually run steps one and two in a focused two-hour workshop; step three, the data collection, tends to take one to two weeks depending on team size. The Ford Foundation's Organizational Mapping Tool is built around exactly this participatory structure, producing consensus ratings and a short list of priority actions as its core output rather than just a diagram. That output, not the picture itself, is what most leaders actually act on.
How do you read an organisational network map?

Organisational network analysis, or ONA, goes beyond formal structure to show how work and information actually move between people. Building one starts with picking your data sources, then choosing the right metrics to interpret what you see.
Reliable inputs typically include:
- Short pulse surveys asking people who they go to for specific types of decisions
- Collaboration data from calendars or communication tools, used at an aggregate level
- Structured interviews to triangulate patterns the survey data alone might miss
Once you have that data, three metrics matter most. Centrality shows who sits at the hub of information flow, regardless of title. Density tells you how tightly connected a team is overall, useful for spotting fragmented departments. Tie strength distinguishes a genuine working relationship from an occasional email exchange. Together, selecting entities and gathering interaction data produces a quantitative summary that reveals bridges (people connecting otherwise separate groups), brokers (people whose exit would cause real disruption), and silos (teams that barely interact with anyone outside their own function).
Pro Tip: Treat any collaboration-log data with care. Voluntary surveys plus interview triangulation tend to be the safer, more consent-friendly route than mining message metadata without people's knowledge.
When should you use organisational mapping?
Mapping earns its keep in a specific set of situations rather than as a permanent ritual. It's the right intervention when:
- You're planning a reorganisation or integrating a merger or acquisition
- A digital transformation programme needs IT and business capabilities properly aligned
- A new leader is onboarding into an unfamiliar structure and needs to understand real decision flows fast
- Persistent handoff delays suggest a process problem hiding behind an org chart
It's usually unnecessary for small, stable teams where everyone already knows who does what. Mapping earns its cost when complexity, change, or ambiguity is already causing friction.
Which templates and facilitator methods are worth using?
You don't need to build a mapping method from scratch. Two established resources cover most of what a facilitator needs, and each suits a different level of formality.
- The Ford Foundation's OMT facilitator guide sets out a participatory, consensus-based process, typically involving staff across levels and, where relevant, board members, to produce ratings and a prioritised action list.
- Org Topologies offers free Miro templates and a simple visual language for mapping resource, delivery, and adaptive structures, built around a four-step map, assess, design, elevate method that helps cross-functional teams align without needing shared jargon.
- Consultancy resources such as Cognistry's work on capability mapping offer a useful reference point for leaders who want a structured, expert-led alternative to running the exercise entirely in-house.
Use a light diagram for a single team or a quick capability check. Reserve a full facilitated exercise, OMT-style, for anything touching multiple functions or a genuine restructuring decision.
Why static organisational maps stop working
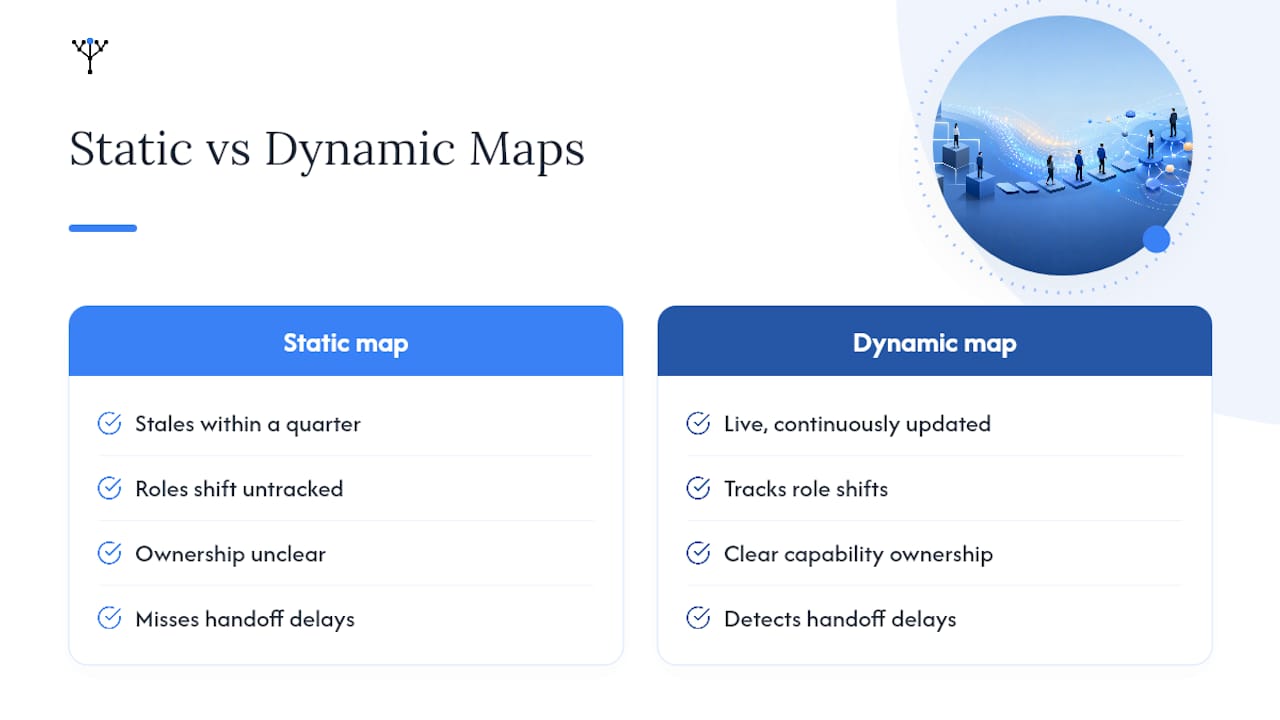
Most organisational maps go stale within a quarter. Roles shift, teams reorganise informally, and the tidy diagram from the last workshop stops reflecting reality long before anyone schedules a refresh. That gap is where decision quality quietly erodes.
A live organisational model behaves differently. It keeps structure, capability ownership, and process data connected to what's actually happening across HR, finance, and operations, so resource allocation and risk detection happen before a small gap becomes a costly one. The practical test for any leader is simple: run a scoped pilot on one function, watch whether the model catches a handoff delay or an unowned capability before your team does, and judge it on that.
— Ronan
How Oak & Nine keeps your organisational map current
The methods above get you a strong current-state view. The harder problem is keeping that view accurate once the workshop ends and the business moves on, which is exactly where a one-off mapping exercise tends to fall short.
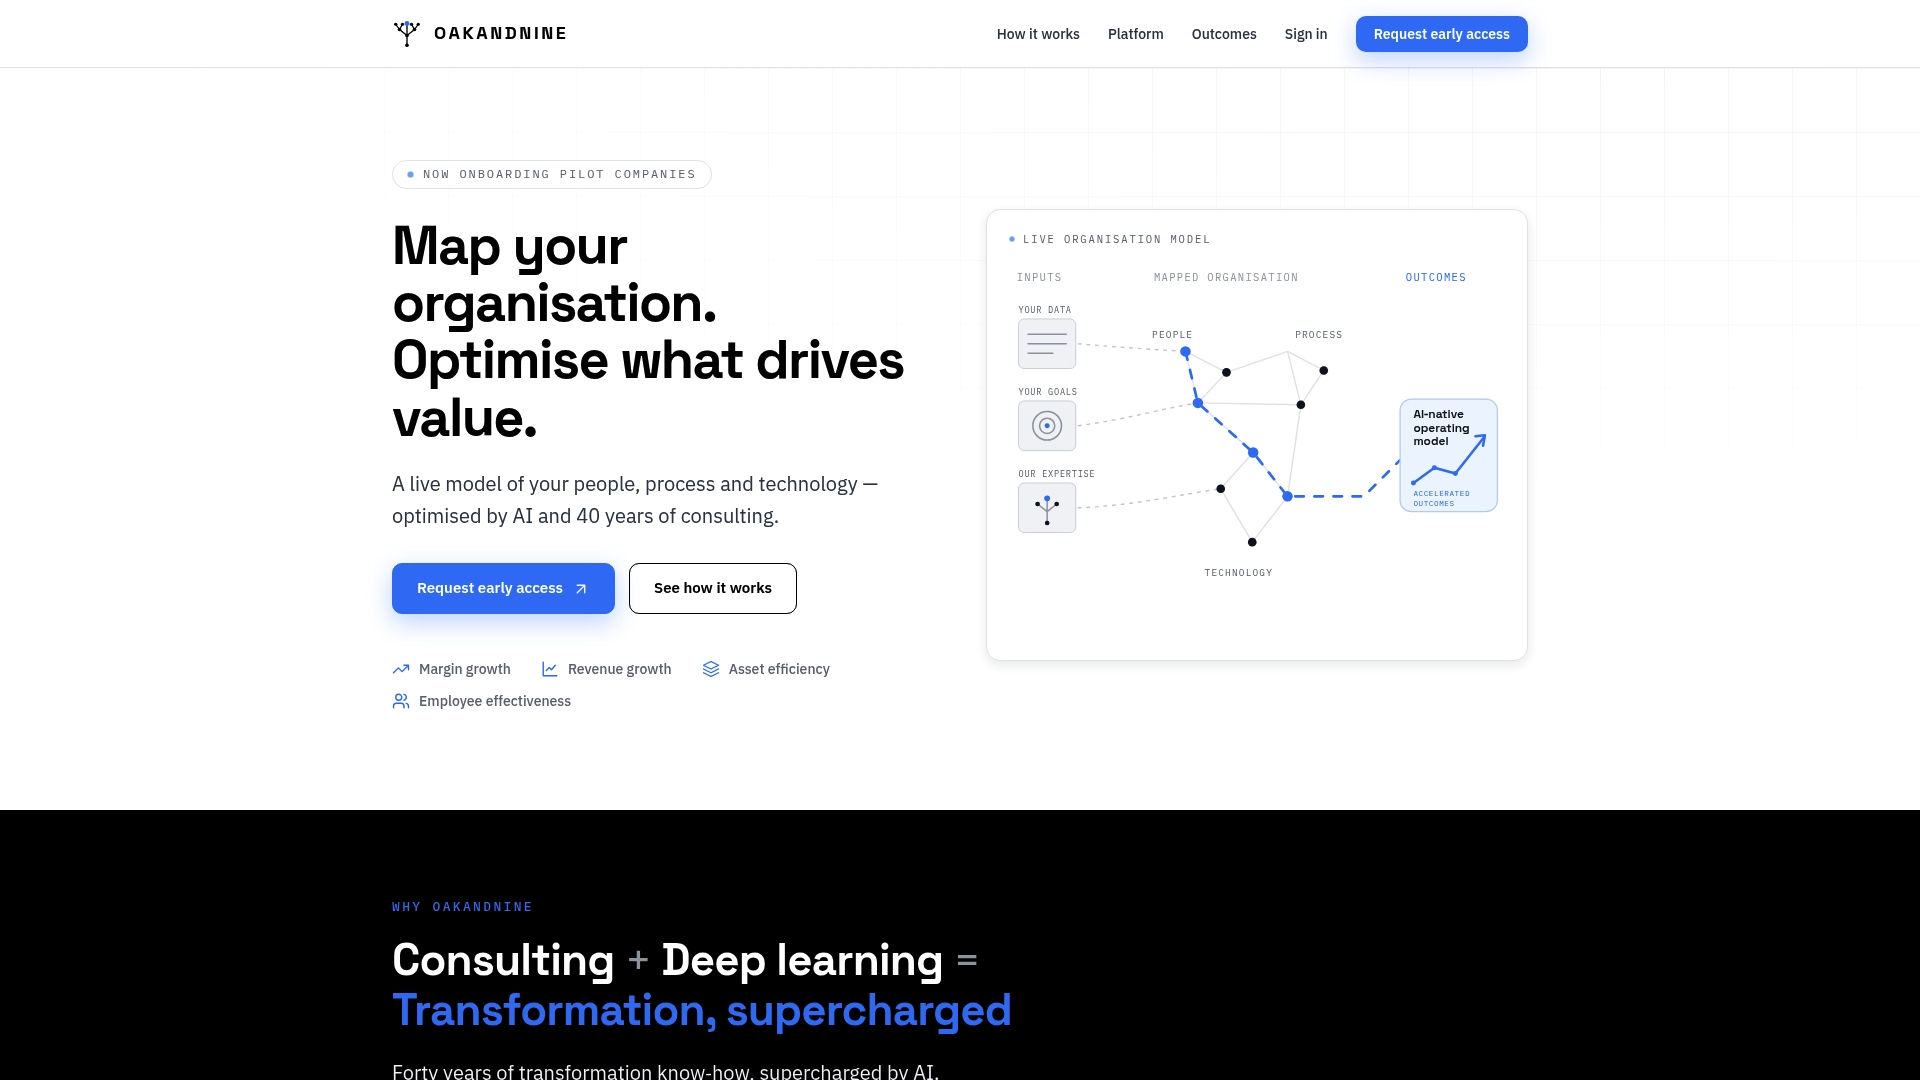
Oakandnine is built around a live organisational model rather than a static diagram, pulling structured and unstructured data from across your systems so ownership gaps and process bottlenecks surface as they happen, not months later at the next review. Instead of a workshop output that ages the moment it's finished, you get continuous integration across HR, finance, and operations, plus preemptive alerts when a capability or process starts to strain before it fails outright. A typical pilot focuses on one function or division, connects the relevant systems, and gives leaders a working view of ownership and bottlenecks within weeks rather than another mapping cycle. If you're weighing up whether to run this as a live model, the Managing Directors page sets out how a pilot is scoped and what to expect in the first few weeks.