
Organisational network analysis (ONA) maps how work actually flows between people, revealing exactly where collaboration, bottlenecks or informal influence shape business outcomes that the org chart never shows. It typically shortens merger integration timelines, exposes hidden single points of failure, and gives leaders evidence for hybrid work decisions instead of guesswork. The rest of this guide covers the methodology, the tools, and the interventions that turn that evidence into action.
TL;DR:
- Combining active surveys with passive communication data improves the accuracy of network maps and reduces response bias.
- ONA is most effective when used to address specific business questions and paired with targeted interventions, rather than broad culture assessments.
- Regular, ongoing use of live network analysis helps sustain insights and informs resource decisions in real time, rather than relying on static, one-off reports.
- Key metrics such as centrality, brokerage, and density should be cross-referenced with performance data before acting to avoid overestimating influence or overload.
- Clear governance, privacy measures, and motivated sponsors are critical to collecting meaningful data and maintaining trust in the process.
Table of Contents
- What is organizational network analysis, and how does it differ from an org chart?
- What business problems does ONA actually solve?
- How do you run an organizational network analysis step by step?
- What do centrality, brokerage and density actually tell you?
- How does Oak & Nine turn network insight into ongoing practice?
- What formal and informal networks exist inside an organisation?
- What do successful ONA implementations look like in practice?
- Why is data collection hard in ONA, and how do you fix it?
- Three questions to ask before commissioning an ONA
- Turn your network findings into daily operational change
- Sources
What is organizational network analysis, and how does it differ from an org chart?
An org chart tells you who reports to whom. Organisational network analysis tells you who people actually talk to, trust, and turn to when something needs solving. Rob Cross's foundational work on ONA frames it precisely this way: the method measures and visualises patterns of interaction, collaboration, and information flow, surfacing the informal networks that drive performance well beyond what a reporting line ever captures.
The core building blocks are simple. A "node" is a person, team, or unit. A "tie" is a relationship, be it a communication link, an advice exchange, or a trust bond. String enough nodes and ties together and you get a network map that shows density, distance, and structural gaps a hierarchy chart cannot.
Two collection approaches sit behind that map, and the distinction matters more than most executives assume:
- Active collection relies on surveys asking people directly who they collaborate with or seek advice from, capturing perception and relationship quality.
- Passive collection draws on collaboration metadata, meeting logs, and communication patterns, capturing behaviour at scale without relying on memory or self-report.
ONA doesn't replace engagement surveys or people analytics platforms. It complements them, adding a structural layer that shows why an engagement score dipped, not just that it did. A team can score high on satisfaction and still be one resignation away from a broken workflow.
What business problems does ONA actually solve?
Leaders commission ONA when they need to see the collaboration that formal structure hides, and the return shows up fastest around change events. Four scenarios dominate practitioner use:
- Merger and acquisition integration, where mapping cross-company ties early reveals which teams are actually collaborating versus which exist on paper only, letting integration leads target the gaps.
- Change management programmes, where network maps identify the informal influencers whose buy-in determines whether a new process sticks or dies in week three.
- Innovation network design, where density and reach across R&D or product functions predict how fast ideas move from concept to shipped feature.
- Hybrid and return-to-office planning, where MIT Sloan's research on ONA-informed office strategy shows which teams benefit measurably from colocation and which collaborate just as effectively at a distance.
Pro Tip: Run a lightweight ONA pilot on one function facing a live change event, such as a system migration or a leadership transition, rather than mapping the whole organisation on day one. A scoped pilot proves the method's value before you ask for budget to go wider.
Cranfield School of Management's applied case work reinforces the pattern: organisations that treat ONA as an ongoing diagnostic, not a one-off survey, see integration and change outcomes improve because interventions get tested and adjusted rather than launched once and forgotten.
ONA has limits worth naming upfront. It is the wrong tool when the question is purely about individual performance, when leadership has no appetite to act on uncomfortable findings, or when the organisation is too small for network patterns to mean anything statistically. A team of eight doesn't need a centrality score; it needs a conversation.
How do you run an organizational network analysis step by step?
A network analysis that produces a striking visual and nothing else has failed. The ToolsHero practitioner guide on ONA makes the point bluntly: without a clear business question driving the work, ONA yields interesting pictures but no actionable lever. Here is the sequence that avoids that trap.
- Define the business question first. Are you trying to shorten a merger timeline, reduce burnout risk on key connectors, or decide who needs to sit together after a return-to-office shift? Pick one or two outcomes, not a general "understand our culture" brief.
- Scope the network types to measure. Communication networks, advice networks, and trust networks reveal different things. A merger question needs communication and collaboration ties; a succession-planning question needs advice and influence ties.
- Combine data sources deliberately. Blend survey responses (perception, relationship quality) with collaboration metadata (calendar density, email or chat volume) and HR records (tenure, role, location). No single source tells the full story.
- Produce outputs that map to decisions. Centrality scores, broker identification, and density heatmaps only matter if each one is tied to a named decision, such as reassigning a bottlenecked approver or restructuring a team's meeting cadence.
- Design interventions as pilots, not mandates. Test a structural change with one team, measure the network shift over 90 days, then scale what worked.
- Build in privacy and consent checkpoints at every stage. Anonymise where possible, be transparent about what's being measured and why, and never present findings as individual performance scores.
Deloitte's guidance on ONA is explicit on that last point: the method should help understand human connections and identify barriers, never function as a surveillance tool. Skip that principle and you lose employee trust faster than you gain organisational insight.
What do centrality, brokerage and density actually tell you?
Raw network metrics mean nothing until you translate them into a decision. Three measures do most of the work:
- Degree centrality counts how many direct connections a person has, flagging potential overload when one individual sits at the centre of too many workflows.
- Betweenness centrality identifies who sits on the shortest path between otherwise disconnected groups, meaning that person's absence would slow multiple workflows at once.
- Brokerage and bridging roles mark the people connecting silos that would otherwise never talk. Rob Cross's research on network brokers shows that identifying these bridges and redistributing their load can noticeably speed processes like product development, because a single overloaded broker often becomes the bottleneck nobody named.
- Density and modularity show whether collaboration flows freely across a team (high density, low modularity) or clusters into isolated pockets (high modularity), a common early warning sign of siloed communication.
- Tie strength distinguishes a frequent, deep working relationship from a once-a-quarter email exchange, and matters when deciding who genuinely influences a decision versus who's just copied on it.
None of these numbers stand alone. Cross-reference a high betweenness score against delivery data or engagement scores before acting. A broker who's also burning out on engagement metrics needs workload redistribution, not praise for being "central."
How does Oak & Nine turn network insight into ongoing practice?
Most ONA programmes stall at the report stage. Findings sit in a slide deck, the sponsor moves to another priority, and six months later nobody can say whether the intervention worked. Oak & Nine was built to break that pattern by keeping the organisational model live rather than treating it as a point-in-time survey.
The platform connects HR, Finance, Operations, and other functions into one framework, so a network gap identified this quarter shows up automatically the next, rather than requiring a fresh data collection cycle. Real-time insights flag emerging bottlenecks, and preemptive alerts mean a manager can act on a broker overload or an ownership gap before it becomes a missed deadline.
A network map is only as useful as the next decision it triggers. The organisations that get value from ONA are the ones that keep watching after the first report lands, not the ones that file it away.
For managing directors and operations leaders, that means resource allocation decisions get made against current structural evidence, not a snapshot from last year's engagement survey.
What formal and informal networks exist inside an organisation?
Every organisation runs on at least four distinct network layers, and mistaking one for another is where most ONA programmes go wrong.
Formal networks follow the reporting structure, that is, the org chart, project teams, and committee memberships that leadership designs on purpose. They're visible, documented, and usually the easiest to measure because HR systems already record them.
Informal networks form around trust, shared history, and convenience rather than design. Two people who solved a crisis together three years ago might still be each other's first call, regardless of what the current structure says. Informal networks often carry more weight in getting work done than the formal one, which is exactly why ONA exists.
Within those two layers, the type of tie being measured changes what the map reveals:
- Communication networks show who talks to whom, capturing volume and frequency but not necessarily quality or trust.
- Advice networks show who people turn to when they need expertise or a decision made, often revealing informal experts the org chart never names as leaders.
- Trust networks capture who people would confide in about a sensitive problem, typically the sparsest and most revealing layer of all.
A team can have dense communication ties and thin advice ties, meaning people talk constantly but nobody's actually learning from anyone senior. Mapping all three layers separately, rather than assuming one implies the others, is what turns a network diagram into a genuine diagnostic.
What do successful ONA implementations look like in practice?
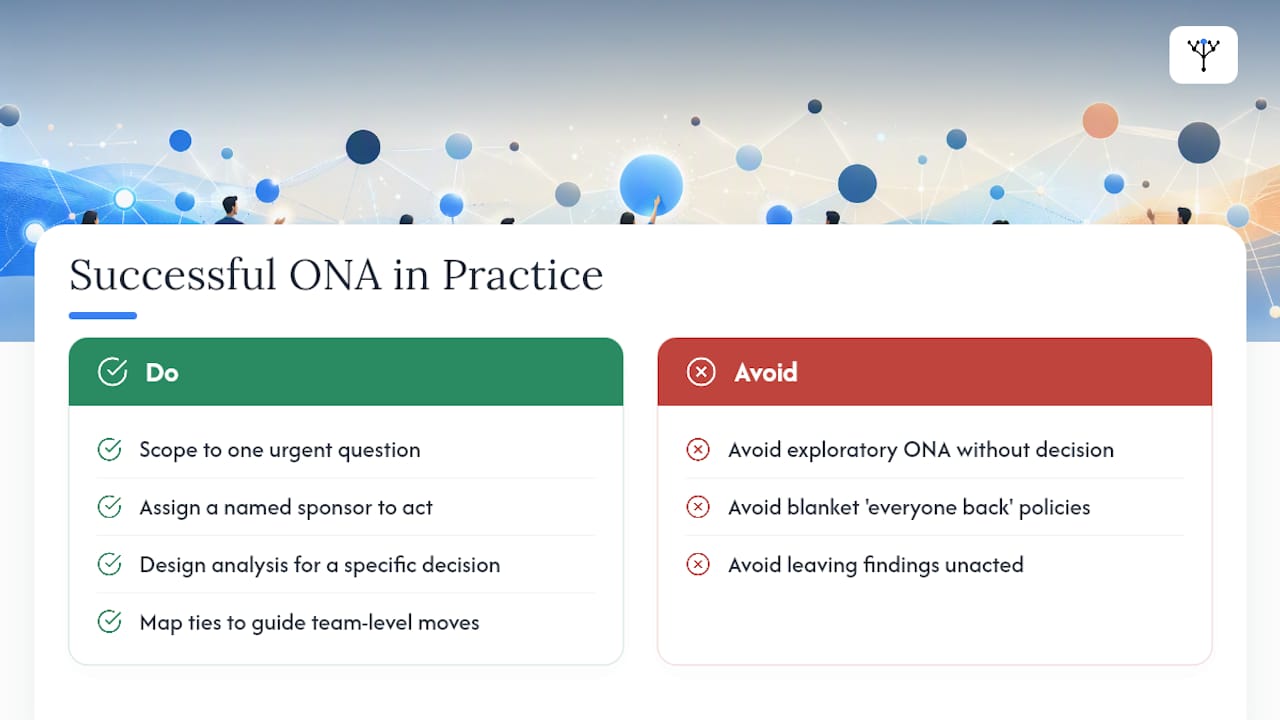
The pattern across documented implementations is consistent: organisations that scope ONA to one urgent business question, and commit to acting on the result, see the clearest returns. Cranfield School of Management's case studies on organisational network analysis document exactly this discipline, applying network mapping to specific structural questions rather than open-ended culture audits.
The hybrid work sector offers some of the clearest recent examples, highlighting practical approaches to hybrid work strategy. MIT Sloan's analysis of return-to-office strategy describes organisations using network data to distinguish teams whose collaboration genuinely benefits from colocation from teams that function just as well distributed, turning what had been a blanket policy debate into a team-by-team evidence base. That's a materially different conversation from "everyone back three days a week because that feels fair."
Merger integration follows a similar logic. Organisations that map cross-entity communication ties in the first 90 days after a deal closes can identify which combined teams are genuinely collaborating and which are operating in parallel without contact, then intervene, whether that's forced co-location on a shared project, restructured reporting, or simply introducing two team leads who've never spoken.
The common thread across every credible case is narrow scope paired with a named sponsor willing to act. Broad, exploratory ONA commissioned without a specific decision attached to it tends to produce a well-designed diagram that nobody references again after the initial presentation.
Why is data collection hard in ONA, and how do you fix it?
Collecting network data runs into problems that standard employee surveys don't face, mostly because you're asking people to name specific colleagues rather than rate a statement on a five-point scale.
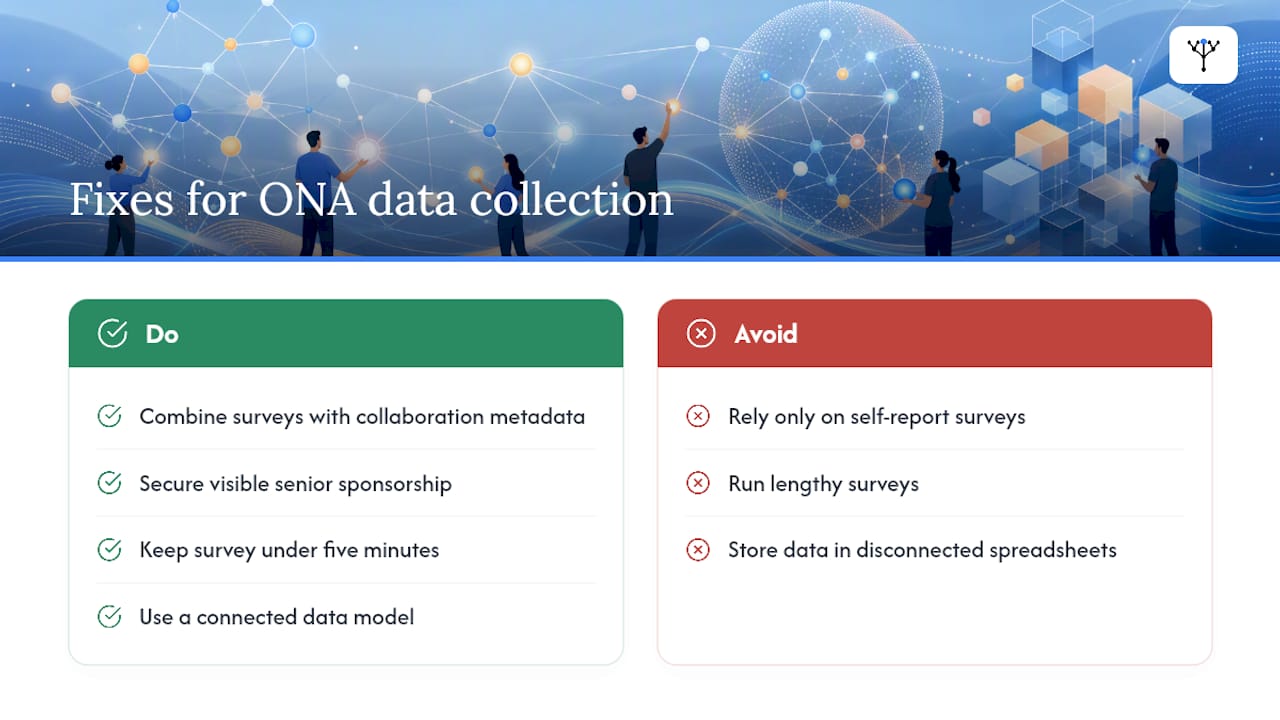
Response bias skews the map before analysis even starts. People often forget peripheral contacts, over-report ties to senior colleagues they want to be seen collaborating with, and under-report informal relationships that feel too casual to mention. The fix is combining survey data with passive collaboration metadata wherever consent and policy allow, so behaviour corroborates or corrects self-report.
Low response rates hollow out the network map. A network survey with 40% participation doesn't just lose data, it distorts every centrality score, because missing nodes make well-connected people look isolated. Securing visible sponsorship from a senior leader before launch, and keeping the survey under five minutes, measurably improves completion rates.
Privacy concerns suppress honest answers, particularly around trust and advice networks where naming a colleague can feel like exposing a workplace dynamic. Anonymising results at the team level, being explicit that individual responses won't be shared with managers, and following Deloitte's guidance to position ONA as a diagnostic rather than surveillance tool all reduce this friction.
Data fragmentation across HR, collaboration, and survey systems makes combining sources technically painful. This is where a connected data model, rather than three disconnected spreadsheets, saves weeks of manual reconciliation before analysis can even begin.
Three questions to ask before commissioning an ONA
Ask honestly: does this need network insight, or would a simpler survey do? Is there a sponsor committed to acting on findings, not just reading them? And are your data, consent, and governance arrangements genuinely ready?
— Ronan
Turn your network findings into daily operational change
Reading a network map is one thing. Keeping it updated as teams shift, projects launch, and bottlenecks move is another entirely, and that ongoing maintenance is where most ONA initiatives quietly die. Oak & Nine is built specifically for that gap: instead of a one-off diagnostic that ages the moment it's presented, it keeps your organisational model live, so a broker overload or an ownership gap surfaces automatically rather than waiting for next year's survey cycle.
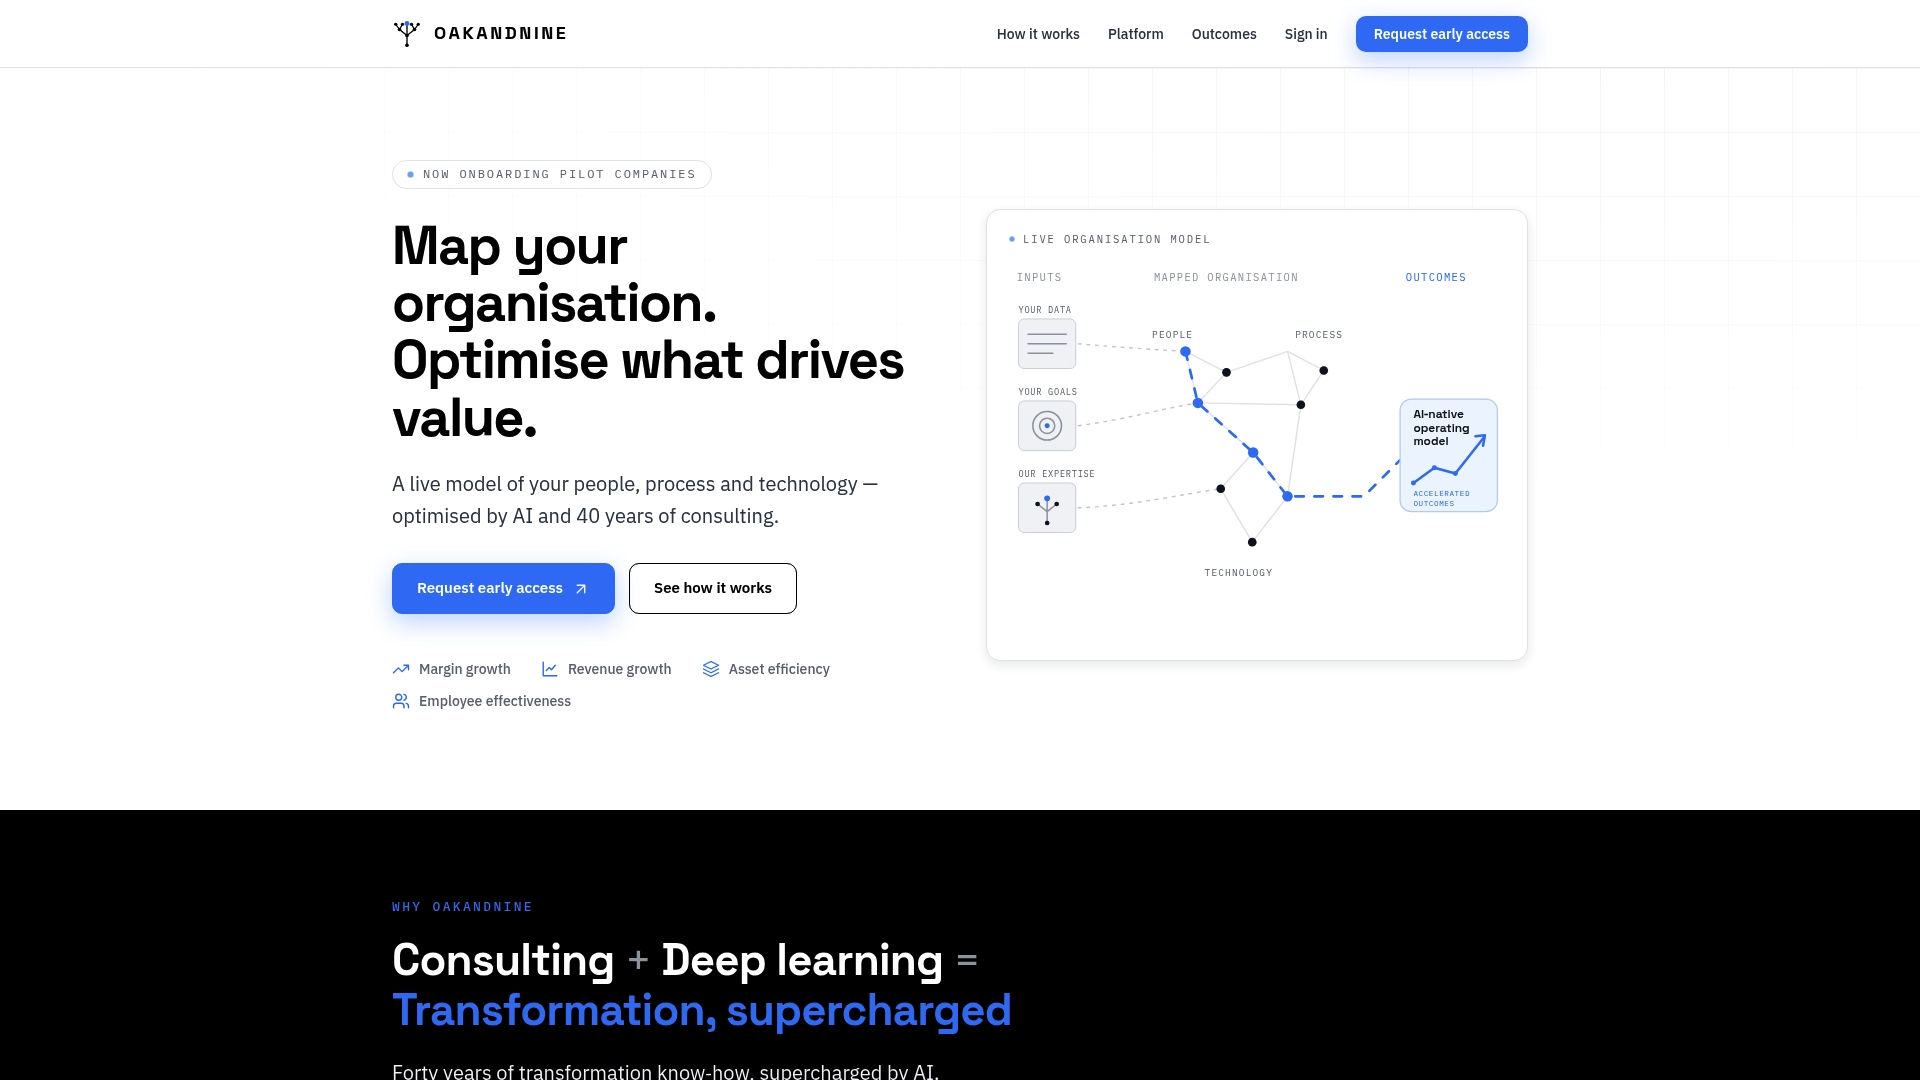
For operations leaders, that means the platform connects HR, Finance, and operational data into one framework, so a network gap identified this quarter doesn't need a fresh round of data collection to verify next quarter. For managing directors weighing where to intervene first, Oak & Nine's dedicated resource for senior leaders walks through how real-time insight and preemptive alerts translate structural findings into resourcing decisions before a bottleneck becomes a missed deadline. If your last ONA report is already gathering dust, request a pilot and see what a live model shows about your organisation this week rather than last year.
Sources
The technical choice usually comes down to how much control you want against how fast you need results. Three broad categories cover most programmes:
- What is Organizational Network Analysis (ONA)? • Rob Cross
- Optimizing return-to-office strategies with organizational network analysis | MIT Sloan
NetworkX's own documentation makes the trade-off clear: open-source libraries excel at prototyping and research depth, while production programmes that need governance, integration, and automation typically outgrow them.
Whichever route you choose, anonymisation and access controls aren't an afterthought. Aggregate data to team level wherever individual-level detail isn't strictly needed for the decision at hand, and agree data retention limits before collection starts, not after someone asks.