
Overall equipment effectiveness is Availability multiplied by Performance multiplied by Quality, expressed as one percentage that tells you how much of your equipment's true production potential you actually capture. It matters because most plants are losing 15 to 40 points of capacity to problems nobody has ever quantified. OEE, standardised by MESA and Seiichi Nakajima's Total Productive Maintenance work, turns that guesswork into a diagnostic you can act on.
TL;DR:
- Better understanding and standardization of boundary rules are essential for accurate OEE measurement and cross-plant comparisons.
- Using direct sensor data instead of manual logs can reveal an 8 to 15 percentage point increase in measured OEE.
- Focus improvement efforts on the largest micro-stops and hidden speed reductions to unlock the most capacity gains.
- Standardize capturing the five core inputs and run parallel audits to prevent data drift and ensure reliable OEE tracking.
- Implement ongoing, collaborative diagnostics that involve all stakeholders to sustain a practical and effective OEE program.
Table of Contents
- What is overall equipment effectiveness and when should you use it?
- How do you calculate OEE, step by step?
- What do the three OEE components and six big losses actually measure?
- What counts as a good OEE score?
- Why does your OEE number keep moving, and how do you fix it?
- What actions actually move each OEE component?
- How does real-time data turn OEE into a predictive tool?
- What does it take to run an OEE programme that survives contact with the shop floor?
- How Oakandnine keeps your OEE numbers honest and actionable
- Where to go next for deeper OEE reading
- Sources
What is overall equipment effectiveness and when should you use it?
OEE emerged from Nakajima's Total Productive Maintenance research in Japan during the 1960s and 1970s, built to answer a simple question: out of all the time a machine could theoretically run at full speed making perfect parts, how much did you actually get? The standard definition is Availability × Performance × Quality, and you can reach the same number two ways. The multiplicative route breaks losses into three separate percentages you can diagnose independently. The alternative, "Fully Productive Time" divided by "Planned Production Time," gives you the identical figure but hides which lever to pull.
Both views matter to an operations manager. The multiplicative version is what you report and benchmark against. The fully productive time version is what you use to sanity check the maths when a number looks wrong.
OEE isn't the only tool in this family, and knowing when to reach for a related metric saves you from misreading your own data:
- OEE measures effectiveness against scheduled production time. Use it for shift-level and line-level performance reviews.
- TEEP (Total Effective Equipment Performance) measures against all calendar time, including hours you never scheduled. Use it when deciding whether to add a shift or invest in new capacity.
- OOE (Overall Operations Effectiveness) drops the "planned" filter Availability normally applies, useful when you want a stricter view of true utilisation.
Pick OEE for day-to-day improvement work; reach for TEEP when the conversation turns to capital spend.
How do you calculate OEE, step by step?
Reliable OEE calculation starts with five inputs captured the same way, every shift, on every line:
- Planned Production Time: total shift time minus scheduled breaks and planned maintenance.
- Run Time: Planned Production Time minus unplanned downtime.
- Ideal Cycle Time: the theoretical fastest time to produce one part, taken from the manufacturer's nameplate or engineering specification, not a comfortable historical average.
- Total Count: every unit the line produced, good or bad.
- Good Count: units that passed quality checks first time, with no rework.
From those five numbers, the formulas are straightforward:
- Availability = Run Time ÷ Planned Production Time
- Performance = (Ideal Cycle Time × Total Count) ÷ Run Time
- Quality = Good Count ÷ Total Count
- OEE = Availability × Performance × Quality
Here's a worked example. A line is scheduled for an 8 hour (480 minute) shift, with 30 minutes of planned breaks, leaving 450 minutes of Planned Production Time. Unplanned downtime eats 45 minutes, so Run Time is 405 minutes. The ideal cycle time is 1 minute per part, and the line produces 360 parts in that run time, of which 345 pass quality checks first time.
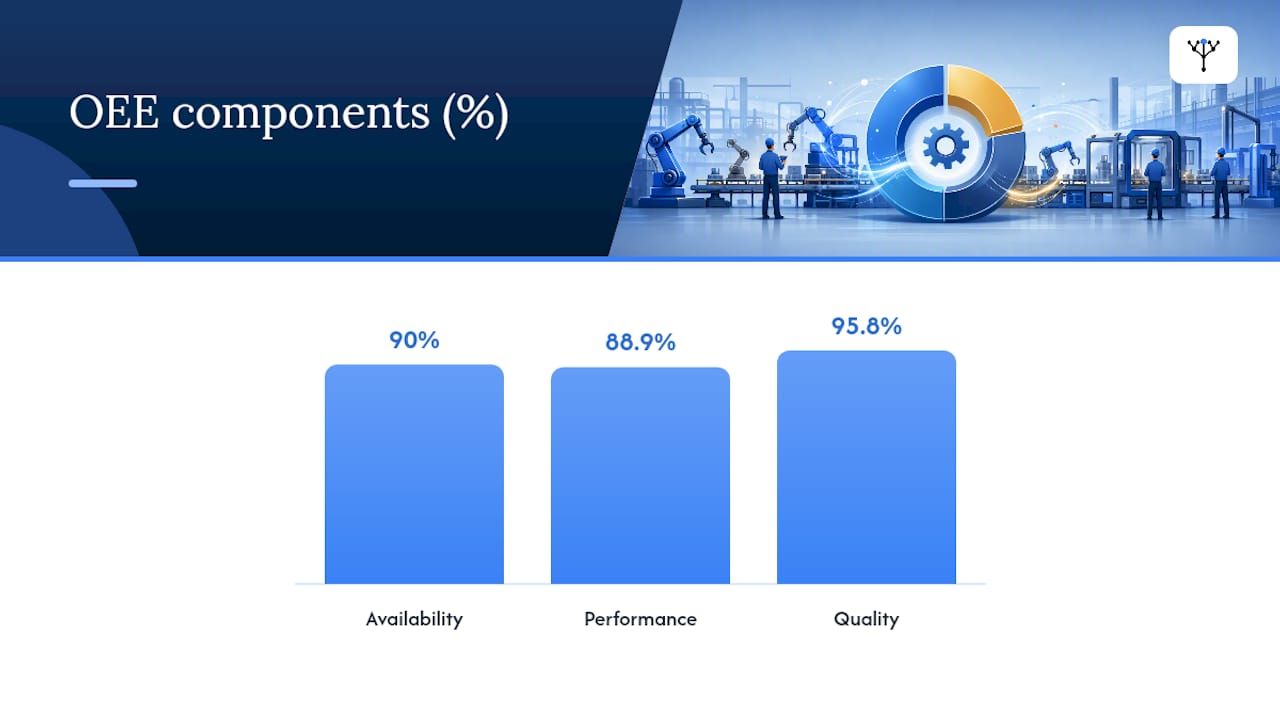
Availability = 405 ÷ 450 = 90%. Performance = (1 × 360) ÷ 405 = 88.9%. Quality = 345 ÷ 360 = 95.8%. Multiply them together and OEE comes out at 76.7%, a respectable score sitting inside the "good" band. Run the same figures through the Fully Productive Time route (Ideal Cycle Time × Good Count ÷ Planned Production Time) and you land on precisely the same 76.7%, which is the check worth running whenever a number surprises you.
What do the three OEE components and six big losses actually measure?
Each component of OEE isolates a different category of waste, and each maps directly onto the classical Six Big Losses framework that Nakajima's followers built to make TPM actionable on the shop floor.
Availability captures whether the equipment was running when it was scheduled to run. It absorbs two of the six losses:
- Equipment failure (breakdowns, unplanned mechanical or electrical stops)
- Setup and adjustment (changeovers, tooling swaps, warm-up time)
Performance captures whether the equipment ran at the speed it was capable of. It absorbs the two losses that hide best:
- Idling and minor stops (jams, misfeeds, sensor faults under a few minutes)
- Reduced speed (running below rated cycle time to protect quality or avoid a fault)
Quality captures whether the output was usable. It absorbs the final two losses:
- Process defects (in-process scrap and rework during a stable run)
- Reduced yield (startup losses, warm-up scrap, and losses during ramp-up after a changeover)
Mapping a loss to its component before you chase a fix is what separates a useful OEE programme from a vanity number. If Availability is weak, you're looking at maintenance and changeover discipline. If Performance is weak despite few recorded stops, you're almost certainly looking at micro-stops and speed reductions that never generated a stop event in the first place, which is exactly the loss category most legacy systems miss.
What counts as a good OEE score?
Benchmarking only works if everyone is measuring the same thing the same way, so treat these bands as directional rather than a scoreboard to chase blindly. The commonly cited figures, per TeepTrak's benchmark analysis, run as follows: world-class sits around 85%, good spans 65 to 85%, average falls between 50 and 65%, and anything under 50% signals substantial recoverable capacity sitting on the table.
Those numbers only mean something when the boundary rules behind them are consistent. A plant that excludes changeovers from downtime and one that includes them will produce Availability scores 8 to 12 points apart on identical equipment, which makes cross-plant comparison meaningless until definitions are locked. Treat the world-class figure as an aspiration, not a monthly target.
Why does your OEE number keep moving, and how do you fix it?
Most OEE disputes trace back to boundary decisions rather than bad data. The most common inflation trap is treating changeovers as planned stops excluded from the calculation entirely. Do that and Availability jumps 8 to 12 points versus counting changeovers as downtime, flattering the number without changing anything on the floor.
Standardising the calculation doesn't require new hardware, just discipline:
- Write down, in one document, exactly what counts as planned time, unplanned downtime, a defect, and rework for every line.
- Freeze the five core inputs (Planned Production Time, Run Time, Ideal Cycle Time, Total Count, Good Count) so no shift redefines them mid-month.
- Run a short parallel audit comparing your current method against a second, independent capture method on the same line.
Pro Tip: Run a 48 to 72 hour parallel capture using direct sensors alongside your existing method before trusting a new baseline. It's the cleanest way to quantify exactly how far your legacy numbers have drifted from reality.
What actions actually move each OEE component?
Improvement work only pays off when it's aimed at the component actually losing capacity, so triage before you act: rank losses by size first, then by how easily you can fix them, and start where the two overlap.
Availability gains come from three levers working together:
- Build a Total Productive Maintenance rhythm where operators handle basic upkeep, freeing maintenance teams for genuine failure prevention.
- Apply preventive maintenance schedules based on failure history rather than calendar convenience.
- Adopt SMED (Single-Minute Exchange of Die) principles to cut changeover time, since faster changeovers reclaim Availability without touching the equipment itself.
- Build a rapid-response protocol for breakdowns, because the minutes lost waiting for a technician to arrive count exactly the same as the repair itself.
Performance gains usually hide in the data you're not collecting:
- Capture cycle times at a granular level, ideally second by second, because minute-level logging misses the micro-stops that quietly erode Performance.
- Investigate every micro-stop pattern rather than dismissing them as noise; a two-minute jam recurring forty times a shift is a bigger loss than one dramatic breakdown.
- Optimise feed rates and changeover sequencing so the line ramps back to full speed faster after every stop.
Quality gains depend on catching problems before they repeat:
- Standardise startup procedures so ramp-up scrap after a changeover stops being treated as unavoidable.
- Strengthen first-pass yield checks at the point of production, not at final inspection, where the root cause has already vanished.
- Root-cause every reactive defect rather than reworking it and moving on, since unaddressed defects reappear at the same rate next shift.
Pro Tip: Rank losses by size in minutes lost, not by which one is easiest to talk about in a meeting. The largest number on the loss tree usually isn't the breakdown everyone remembers, it's the accumulated micro-stops nobody logged.
How does real-time data turn OEE into a predictive tool?
Legacy PLC and manual OEE tracking systematically under-report Performance losses because micro-stops and speed reductions rarely trigger a logged stop event. Direct sensor capture closes that gap, and the gap is not small.
Plants that switch from manual or legacy PLC tracking to direct sensor capture typically uncover an 8 to 15 percentage-point gap between what they thought their OEE was and what it actually was, almost entirely hidden inside unreported Performance losses.
Closing that gap changes what OEE can do for you. With continuous, integrated data feeds, OEE stops being a report you read the morning after a bad shift and becomes an input to prediction:
- Predictive maintenance models flag Availability risk before a breakdown happens, using vibration or temperature trends rather than a failed part as the trigger.
- Computer vision systems catch Quality defects at the point of production instead of at final inspection, shrinking reduced-yield losses.
- Unified data models let you see Availability, Performance and Quality losses against HR, maintenance and planning data in one place, rather than reconciling three spreadsheets after the fact.
Oakandnine's approach to operational efficiency is built on this principle: a live organisational model that captures the five OEE inputs directly rather than relying on operators to log them accurately at the end of a twelve-hour shift.
What does it take to run an OEE programme that survives contact with the shop floor?
Introduce OEE as a scorecard for blaming individual operators, and it dies within a month, buried in disputed numbers and shift-handover arguments. Introduce it as a shared diagnostic, and it becomes the common language that finally gets maintenance, planning and the shop floor agreeing on what the actual problem is.
The single biggest predictor of whether an OEE programme survives its first quarter is whether someone owns the definitions. Assign one person, usually an operations manager, to lock the boundary rules and defend them against every "just this once" exception. Build a daily five-minute review cadence, not a monthly post-mortem, because losses caught same-shift get fixed same-shift.
For the first 90 days, keep the scope narrow: pick one line, freeze the five inputs, run the 48-hour parallel audit, then expand only once the numbers stop generating arguments.
— Ronan
How Oakandnine keeps your OEE numbers honest and actionable
The gap between a plant that trusts its OEE number and one that argues about it every shift almost always comes down to one thing: whether the five inputs are captured automatically or reconstructed from memory. Oakandnine replaces the spreadsheet reconciliation with a live organisational model that pulls Availability, Performance and Quality data straight from connected systems, so the definitions you lock stay locked.
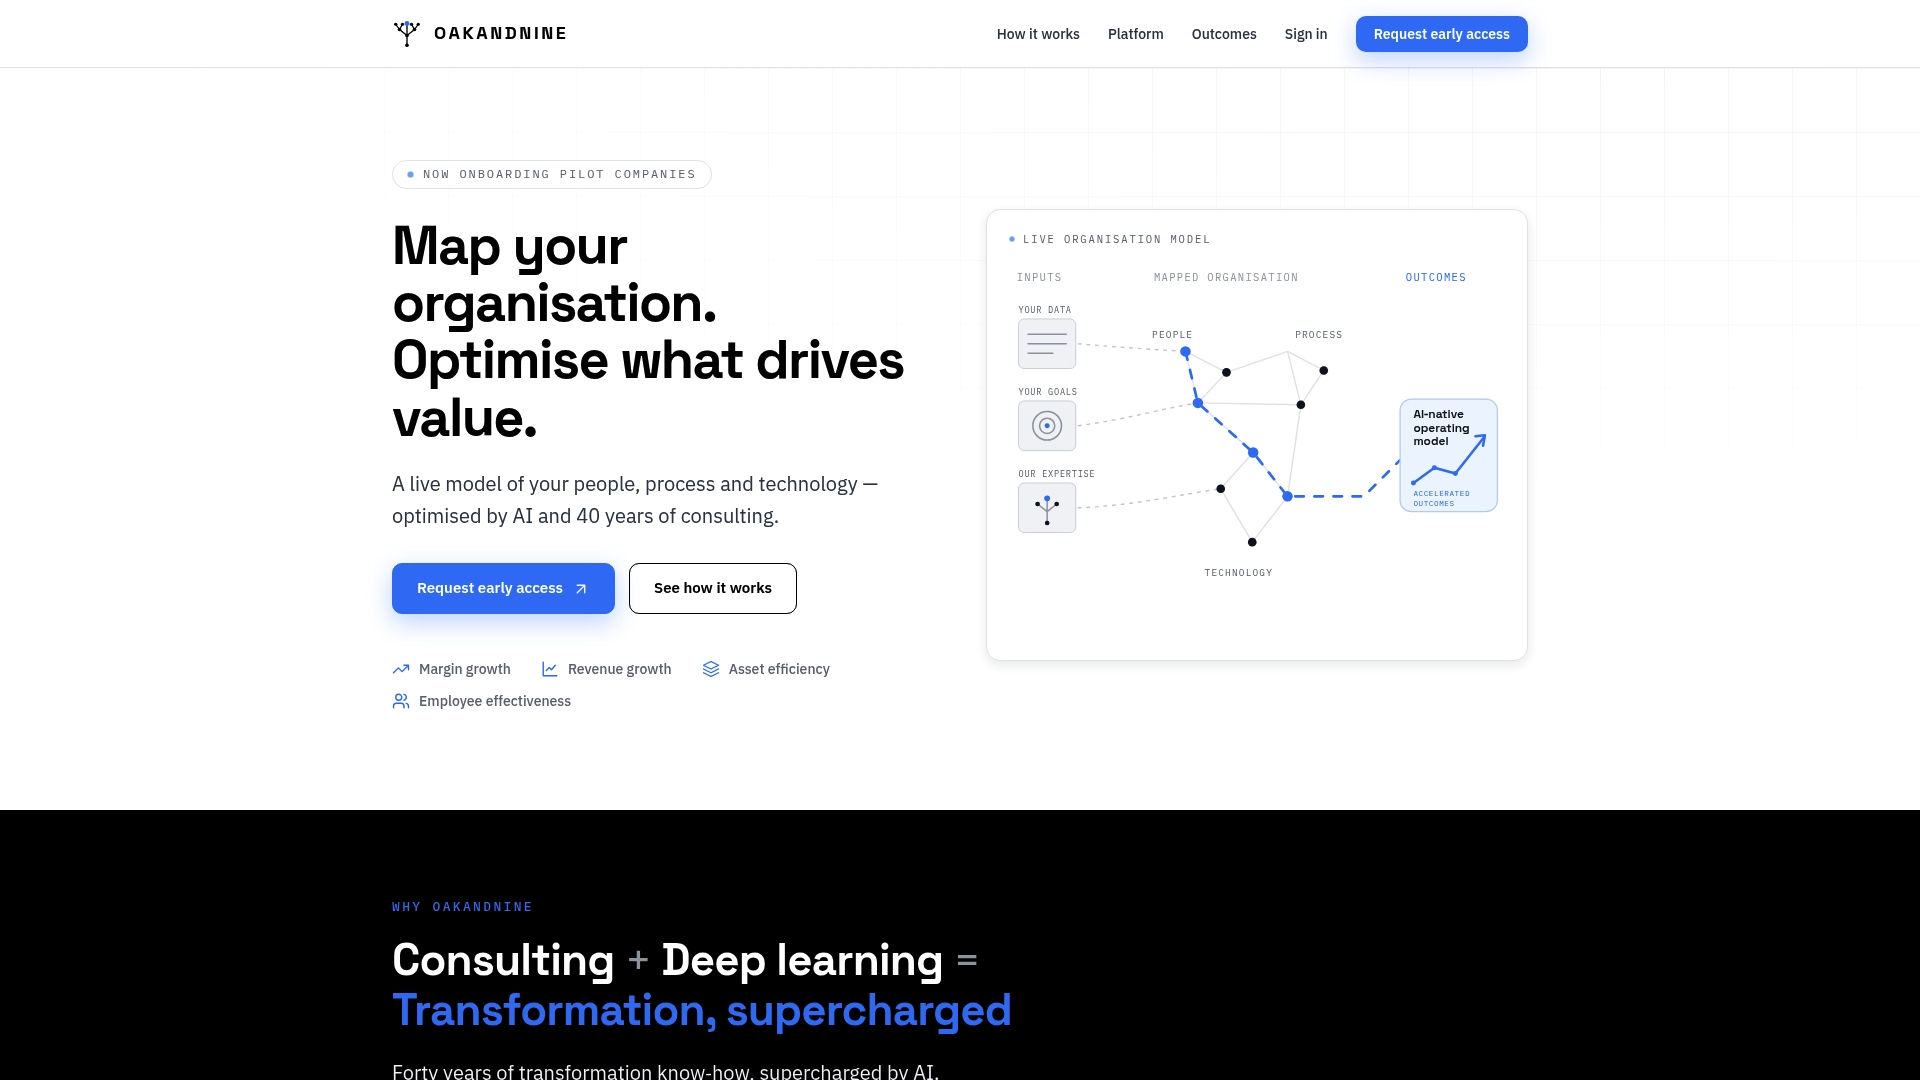
Instead of maintenance, planning and operations each holding their own version of the truth, Oakandnine's connected framework unifies that data in one place, flags emerging losses before they show up as a bad shift, and gives your team a single, governed source of record during onboarding. That governance layer is what turns a 48-hour parallel audit from a one-off exercise into a permanent safeguard. For manufacturing leaders ready to see what unified capture looks like on their own lines, Oakandnine's manufacturing solution is the practical next step, built specifically around the operational metrics teams already rely on.
Where to go next for deeper OEE reading
For grounding in the standard formulas and Six Big Losses taxonomy, the Wikipedia entry on OEE is the reference point most practitioners cite first. TeepTrak's complete calculation guide covers standardisation pitfalls in detail. For machine-shop-specific worked examples, see this OEE calculation guide for machine shops.
Sources
- Overall equipment effectiveness — Wikipedia
- What Is OEE? — TeepTrak
- What is Overall Equipment Effectiveness — Databricks blog