
What is a process bottleneck and how do you spot one fast?
The bottleneck of a process is the single step that limits overall throughput — the point where work accumulates faster than it can be cleared, and where lead time grows longest relative to every other stage. Identifying it requires measuring queue growth and throughput imbalance across each step, not just observing where people look busy.
Three signals reliably surface a bottleneck early:
- Growing queue: work-in-progress at a step increases over consecutive weeks
- Cycle time exceeding takt time: the step takes longer than the rate at which demand arrives
- Throughput imbalance: upstream steps produce faster than the suspect step can absorb
Cycle time and backlog volume are more telling than raw processing speed alone. A step that appears fast in isolation can still be the constraint if it is consistently overwhelmed by upstream volume.
Table of Contents
- Calculating lead time and separating activity time from wait time
- Why bottlenecks shift and why cross-department visibility matters
- How AI-driven process mining changes bottleneck detection
- How Oakandnine maps and resolves bottlenecks in mid-market operations
- A step-by-step guide to applying AI-driven process mining in your workflows
- Integrating live process modelling with your existing IT infrastructure
- What mid-market UK operations look like when bottlenecks are resolved
- KPIs to monitor for ongoing bottleneck detection
- How to prioritise bottlenecks by impact and ease of resolution
- Key takeaways
- Oakandnine gives mid-market operations a live view of every constraint
Calculating lead time and separating activity time from wait time
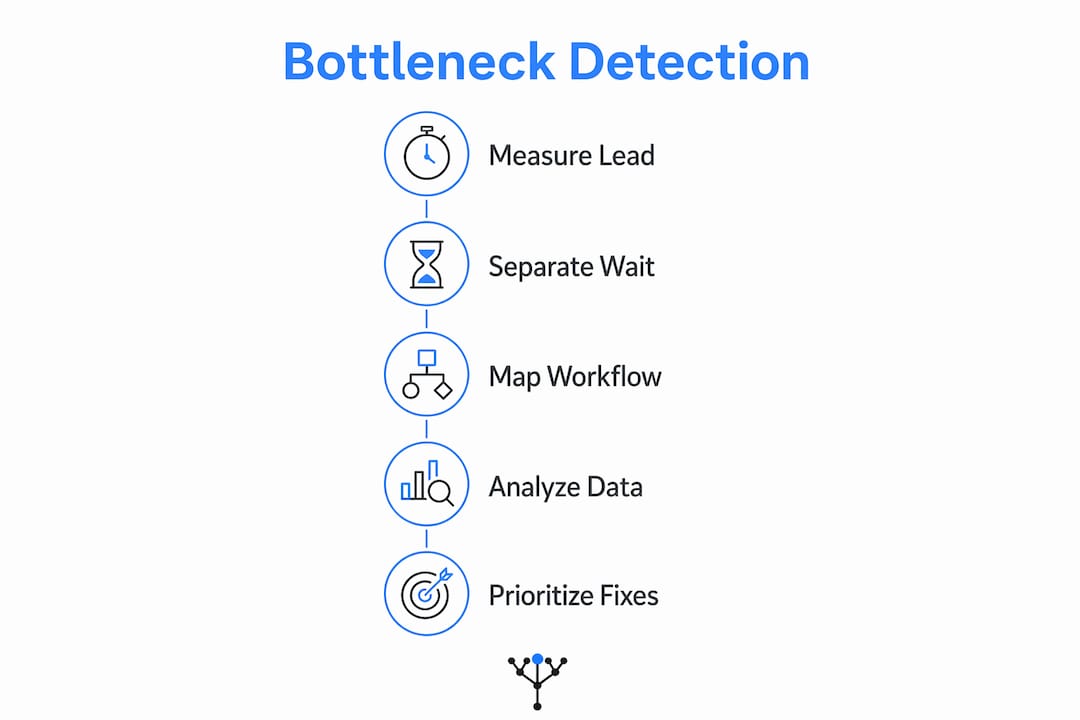
Lead time for each step is calculated as the ratio of work-in-progress to throughput. The step with the longest lead time and a queue that grows over multiple weeks is your bottleneck candidate.
Once you have lead times, the next critical distinction is between activity time and wait time:
- Activity time: the duration a person or system is actively working on a task
- Wait time: the period a task sits idle in a queue, awaiting the next action
Most delays live in wait time, not activity time. Eliminating idle queue time typically yields greater efficiency gains than accelerating active task execution. This is the most common mistake in process bottleneck identification: teams invest in speeding up work that is already being done, while the real delay accumulates in the handoff gaps between steps.
Pro Tip: Before redesigning any process step, map every queue in your workflow and measure how long items sit idle. In most mid-market operations, wait time accounts for the majority of total lead time. Cutting queue time is where the real gains are.
Useful metrics to track per step:
- Average wait time per queue
- Work-in-progress count at each stage
- Throughput rate (units completed per day or week)
- Rework rate (cases returning for correction)
Control charts and Pareto analysis add rigour here, revealing process variation and the largest contributors to delay across a workflow.
Why bottlenecks shift and why cross-department visibility matters

Bottlenecks are rarely static. A constraint in one workflow often originates upstream in a connected process, sometimes in a completely separate department. Fixing the visible symptom without understanding its upstream cause simply moves the problem downstream.
Undocumented handoffs between teams are where bottlenecks most commonly hide. These "seams" between departments are critical mapping points that localised analysis consistently misses. A finance team's approval delay may trace back to incomplete data from operations; a sales pipeline stall may originate in a marketing qualification step that nobody officially owns.
Cross-departmental collaboration during analysis is not optional. Practical guidelines:
- Map the full end-to-end workflow, not individual team segments
- Include informal processes and workarounds in the "as-is" state
- Involve the people who actually do the work, not only their managers
- Survey staff to surface where teams feel overburdened versus underutilised
- Conduct workflow audits at least annually to capture new roles, tools, or process changes
Integrated, live process modelling is the only reliable way to detect constraints that span organisational boundaries.
How AI-driven process mining changes bottleneck detection
AI-driven process mining reconstructs workflows objectively using timestamped event logs from your existing IT systems. Rather than relying on interviews or manually observed process maps, it reads the data trail your operations already generate and surfaces where time accumulates.
The methodology distinguishes active task duration from idle waiting time with precision that manual methods cannot match. Key capabilities:
- Workflow reconstruction: builds the real process map from event logs, including loops and rework paths
- Performance measurement: compares cycle time, lead time, and throughput across every stage simultaneously
- Real-time monitoring: detects emerging queues before they create downstream delays
- Predictive analytics: uses historical data to forecast where the next bottleneck is likely to form
- Natural language processing: analyses tickets and request notes to connect delays to their root causes
The advantage over traditional methods such as Six Sigma's DMAIC or Value Stream Mapping is data volume and objectivity. Process mining does not depend on what people remember or report; it reads what actually happened. For mid-market companies managing complex, multi-system workflows, that distinction determines whether your diagnosis is accurate or merely plausible.
How Oakandnine maps and resolves bottlenecks in mid-market operations
Oakandnine brings four decades of consulting experience to bear through an AI-driven live organisational model that unifies people, processes, and technology data into a single, continuously updated view of how your business actually operates.
The platform captures the "as-is" state with full fidelity, including informal processes, shadow workflows, and undocumented handoffs that idealised process maps routinely miss. This matters because fixing a process you have not accurately mapped means fixing a fiction, not the constraint.
Oakandnine's bottleneck detection capabilities include:
- Real-time workflow mapping across departments and systems
- Friction point identification at handoff seams between teams
- Prioritisation of bottlenecks by impact on throughput and effort required to resolve them
- Asset efficiency and employee effectiveness analysis alongside process data
- Integration with existing IT infrastructure to draw on live operational data
The platform's process optimisation approach targets only the true constraint governing total throughput. Optimising non-constraints wastes effort and can worsen flow by shifting the bottleneck downstream without resolving the underlying cause.
A step-by-step guide to applying AI-driven process mining in your workflows
- Define scope and business goals. Select a specific process where pain is measurable: missed deadlines, client complaints, or margin erosion. Vague scope produces vague findings.
- Access and prepare event log data. Work with IT to identify which systems hold the relevant logs. Ensure data sets are uniformly formatted before analysis begins.
- Connect process mining to your data sources. The tool extracts and transforms log data, then reconstructs the actual workflow, including rework loops and exception paths.
- Define your ideal process model. Use a BPMN editor or your process mining platform to set the baseline against which deviations will be measured.
- Analyse the visualisation. Look for stages where cycle time spikes, queues grow, or throughput drops. Filter by team, task type, or time period to isolate patterns.
- Apply root cause analysis. Use the 5 Whys or Pareto analysis to move from symptom to cause. A kitchen bottleneck may trace back to a front-of-house process that was never formally designed.
- Implement targeted fixes. Solutions follow causes. Capacity issues require redistribution or redesign; knowledge gaps require documentation and training; access issues require policy changes.
- Monitor continuously. Process mining is not a one-time exercise. Build real-time monitoring triggers so emerging constraints are caught before they cascade.
Integrating live process modelling with your existing IT infrastructure
Live process modelling software connects to the systems your organisation already uses: ERP platforms, CRM tools, project management applications, and IT service management logs. The integration does not require replacing existing infrastructure; it reads from it.
Practical steps for a mid-market deployment:
- Audit your data landscape first. Identify which systems hold event logs, timestamps, and workflow data relevant to the process under analysis.
- Establish data governance. Agree on data ownership, access permissions, and refresh frequency before connecting any modelling tool.
- Start with a pilot process. A single end-to-end workflow, such as order fulfilment or client onboarding, gives you a contained environment to validate the integration before scaling.
- Map system dependencies. Understand which tools feed which steps so the live model reflects real data flows, not assumed ones.
- Plan for ongoing data quality. A live model is only as accurate as the data feeding it. Build a process for flagging and resolving data gaps.
Oakandnine's platform is built for this integration context, transforming raw, structured and unstructured business data into a coherent operating model without requiring a wholesale IT overhaul.
What mid-market UK operations look like when bottlenecks are resolved
Consider a UK-based professional services firm managing a client onboarding process across sales, legal, and operations. The visible symptom is a consistent 11-day onboarding cycle against a target of five. The apparent bottleneck is the legal review step. The actual constraint, revealed through process mapping, is that legal receives incomplete client data from sales because no standardised handoff protocol exists. Legal spends the first two days of every review chasing missing information, not reviewing contracts.
The fix is not more legal resource. It is a defined data checklist at the sales-to-legal handoff, enforced through the CRM. Onboarding time drops because the true constraint was addressed.
A manufacturing business in the Midlands presents a different pattern. A production line step appears slow. Measurement reveals the step itself runs within takt time, but upstream batching by a preceding step creates irregular surges that overwhelm it. The bottleneck is the batching logic, not the production step. Smoothing upstream release reduces queue time at the suspect step without any change to its capacity.
Both cases illustrate the same principle: process bottleneck detection requires mapping the full workflow, not just the step where work visibly accumulates.
KPIs to monitor for ongoing bottleneck detection
Sustained operational efficiency requires a small set of metrics tracked consistently, not a comprehensive dashboard reviewed quarterly. Weekly visibility on these indicators is sufficient for most mid-market operations:
| KPI | What it reveals |
|---|---|
| Cycle time by stage | Where total elapsed time concentrates |
| Wait time per queue | Idle time between active steps |
| Work-in-progress count | Volume accumulating at each stage |
| Throughput rate | Output per unit of time per step |
| Rework rate | Cases returning for correction |
| Overdue case count | Steps failing to meet defined deadlines |
| Escalation frequency | Approval or decision steps creating delays |
The workflow automation tools available to mid-market leaders can automate the collection of most of these metrics directly from existing systems, removing the manual reporting burden.
How to prioritise bottlenecks by impact and ease of resolution
Not every constraint deserves equal attention. Prioritisation should be guided by two axes: impact on total throughput and effort required to resolve.
The constraint governing overall throughput takes priority. Addressing a secondary bottleneck while the primary constraint remains untouched produces no measurable improvement in end-to-end flow. This is the core principle of systems thinking applied to process optimisation.
A practical prioritisation framework:
- High impact, low effort: address immediately; these are typically process design fixes, handoff clarifications, or access policy changes
- High impact, high effort: plan carefully and resource properly; these often involve system integration or structural redesign
- Low impact, low effort: batch and address during routine improvement cycles
- Low impact, high effort: deprioritise; the return does not justify the investment
A free SWOT analysis template can help structure the organisational context around each bottleneck before committing to a resolution path. Pair it with your process mining data to connect internal capability gaps to specific workflow constraints.
The discipline here is targeting only the true constraint. Optimising a non-constraint step, however tempting when it is visible and accessible, wastes resource and can shift the bottleneck to a less manageable location downstream.
Key takeaways
Process bottleneck identification requires measuring lead time, separating wait time from activity time, and mapping the full cross-departmental workflow rather than isolated steps.
| Point | Details |
|---|---|
| Lead time reveals the constraint | Calculate work-in-progress divided by throughput per step; the longest lead time with a growing queue is your bottleneck. |
| Wait time dominates delays | Idle queue time typically accounts for more total delay than active task duration; target it first. |
| Bottlenecks shift with upstream causes | A visible constraint often originates in a connected upstream workflow; cross-department mapping is required for accurate diagnosis. |
| AI process mining adds objectivity | Timestamped event logs reconstruct real workflows and distinguish active from idle time with precision manual methods cannot match. |
| Oakandnine for live diagnosis | Oakandnine's AI-driven live model maps people, processes, and technology in real time, identifying friction points and prioritising fixes by throughput impact. |
Oakandnine gives mid-market operations a live view of every constraint
Mid-market businesses in the UK carry a specific operational burden: complex enough to have multi-system, cross-departmental workflows, yet rarely resourced for the kind of continuous process intelligence that large enterprises take for granted. That gap is where margin erodes and growth stalls.
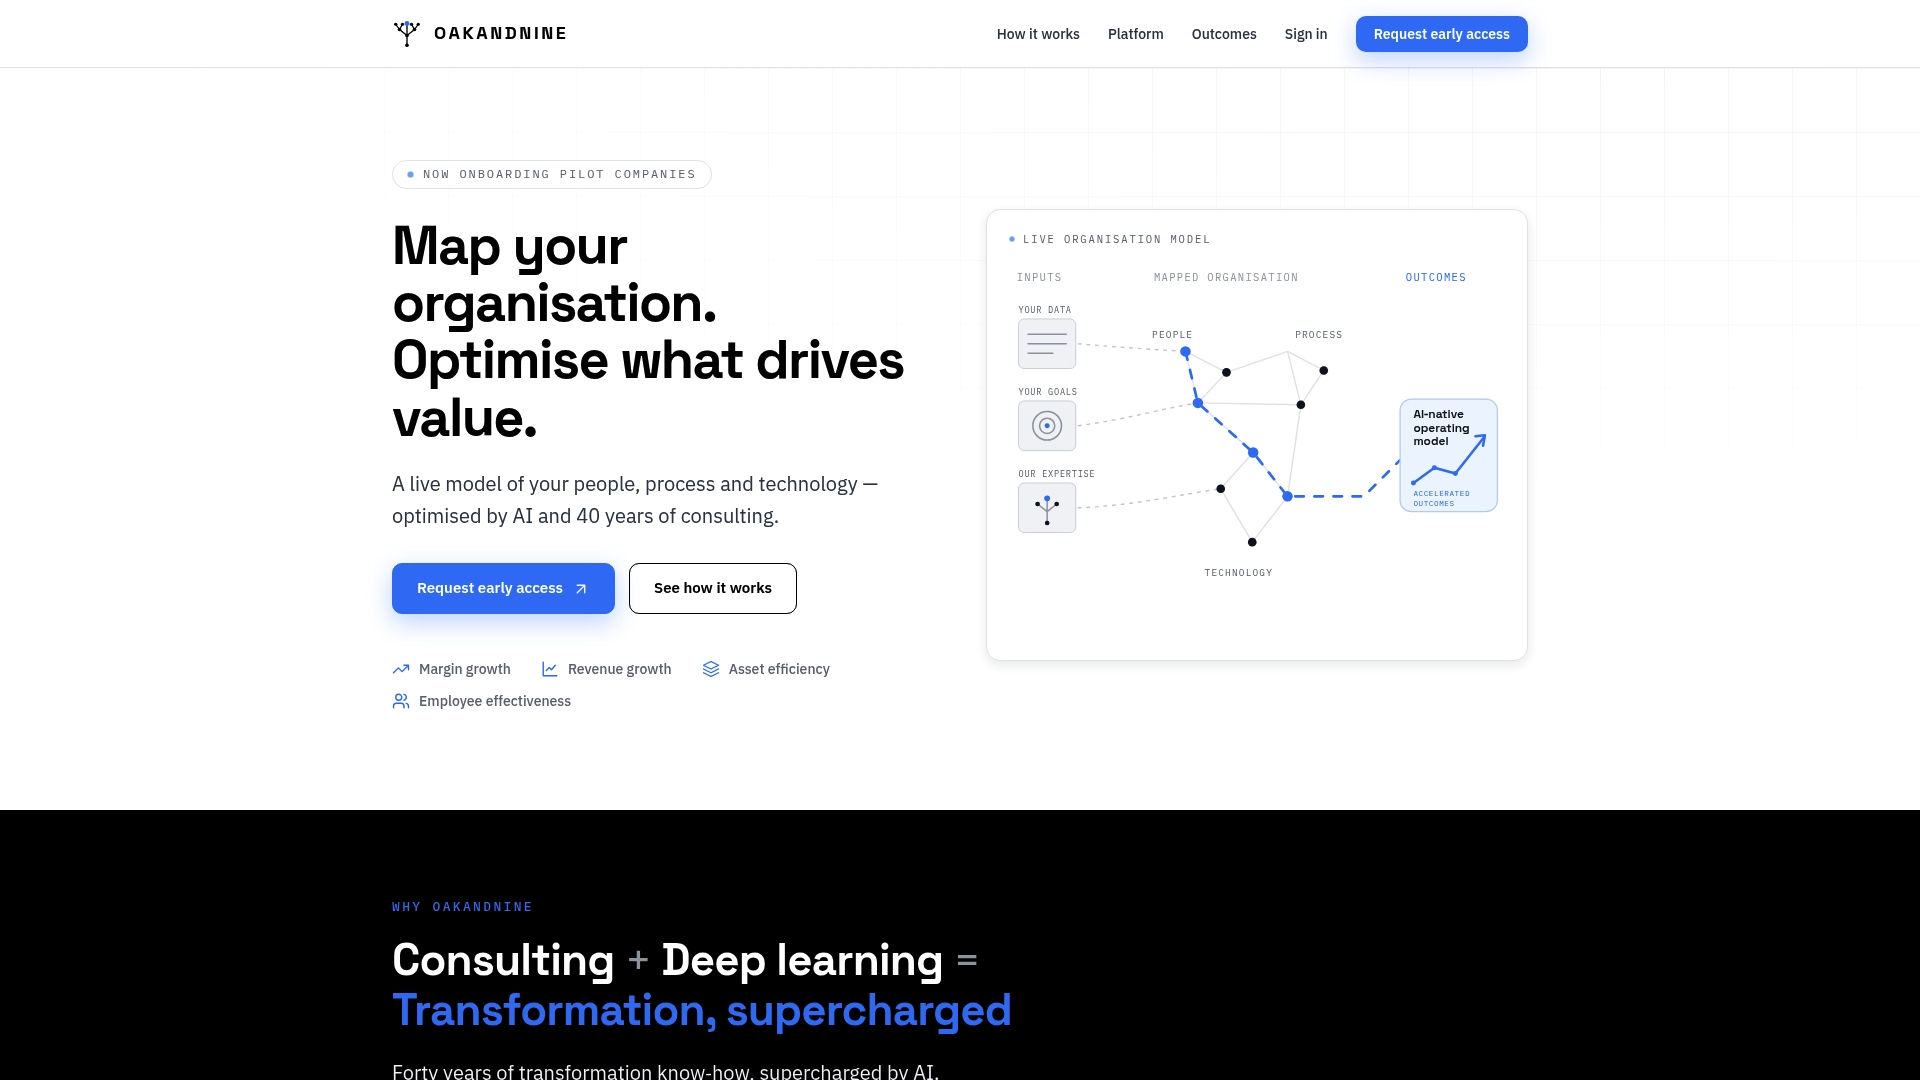
Oakandnine closes that gap. The platform connects your existing systems, maps your actual operating model including the informal processes and undocumented handoffs, and surfaces bottlenecks with the precision of AI-driven analysis backed by four decades of consulting experience. You get a live, integrated view of where work slows, why it slows, and which constraint to address first for the greatest throughput gain.
This is not a reporting tool or a static process map. It is a continuously updated model of how your organisation operates, built to give operations leaders the clarity to act on evidence rather than assumption. To see how Oakandnine applies to your workflows, request a working session with the team.