
Throughput accounting, in the operational sense that matters to mid-market leaders, means measuring how work actually moves through your people, processes and systems using live data, then finding and removing whatever slows it down. It is not a bookkeeping exercise. It is a discipline built on event logs and real-time organisational models that shows you, in weeks rather than quarters, where value is leaking and what fixing it is worth in reduced cycle time and fewer missed service commitments.
TL;DR:
- Most effective throughput metrics focus on cycle time, wait time, rework rate, SLA compliance, and queue depth, which require five key event fields to be reliable.
- Accurate measurement depends on comprehensive, timestamped, and duplicate-free event logs from multiple systems like CRM, ERP, and ITSM, with ownership of data quality.
- A 30- to 60-day pilot on a single workflow and clear owner can identify bottlenecks, simulate fixes, and track leading indicators before implementing broader changes.
- Data quality issues often obscure real delays, with wait time percentage revealing hidden inefficiencies and guiding targeted improvements first.
- Continuous live organizational models driven by platform technology outperform traditional quarterly reporting, enabling proactive bottleneck management and genuine operational improvements.
Table of Contents
- What is throughput accounting in operational terms?
- Which metrics actually reveal throughput?
- Do you have the data to measure this properly?
- How do you run a 30-day throughput pilot?
- Where do throughput pilots go wrong?
- How long until throughput measurement pays off?
- How does this differ from traditional cost accounting?
- What does throughput accounting look like across industries?
- What role does software and automation play?
- How should throughput insights shape strategy?
- What surprises leaders most about throughput accounting?
- How Oak & Nine helps you operationalise this
- Sources
What is throughput accounting in operational terms?
Throughput accounting, as we use the term, is the practice of measuring flow through a live model of your organisation rather than through periodic reports or gut feel. You build a picture of how work genuinely travels between people, systems and departments, using event data pulled directly from the tools those departments already run.
That distinction matters because most operational reporting describes the process as it was designed, not the process as it happens. A live organisational model captures every handoff, delay and rework loop as it occurs, which is precisely what a static process map or a quarterly efficiency review cannot do. You get a working model that updates itself, rather than a snapshot that goes stale the day it is published.
The payoff is concrete: leaders can see which step in a workflow is genuinely constraining output, rather than which step people assume is slow because it is the one they hear complaints about. That gap between perception and reality is where most improvement budgets get wasted.
Which metrics actually reveal throughput?
You cannot manage flow without measuring it correctly, and most organisations measure the wrong things or measure the right things badly. Six metrics do the real work.
- Cycle time — the total elapsed time from when a case enters a workflow to when it exits, calculated from the first and last timestamp against a shared case ID.
- Activity time — the sum of time actually spent working the case, drawn from timestamped start and end events tied to each activity and actor.
- Wait time — cycle time minus activity time, the portion of the journey where nothing is happening to the case at all.
- Wait time percentage — wait time divided by cycle time, expressed as a share. In most unoptimised workflows this figure is uncomfortably high.
- Rework rate — the proportion of cases that return to an earlier activity, calculated from repeated activity names against the same case ID.
- SLA compliance and queue depth — the share of cases meeting their target and the number of cases sitting in a queue at any given moment, both drawn from outcome fields and timestamp comparisons.
Each of these calculations depends on the same five event fields: case ID, activity name, actor, timestamp and outcome. Miss any one of them consistently and the metric built on top of it becomes unreliable.
Treat cycle time and SLA compliance as your headline metrics, the ones you report upward. Wait time percentage, rework rate and queue depth are leading indicators. They move first and they tell you why the headline numbers are about to shift. AI process mining reconstructs actual workflows from event logs and typically surfaces the genuine constraint within two to four weeks once this data is flowing, with cycle-time reductions of around a quarter to two-fifths achievable after the right fix is applied.

Do you have the data to measure this properly?
Throughput measurement is only as good as the event data underneath it, and this is where most pilots stall before they start. Your event logs will typically come from four places: your CRM for sales and service handoffs, your ERP for financial and procurement workflows, your ITSM platform for internal tickets, and production execution systems if you manufacture anything physical. Each needs to expose the same minimal schema: case ID, activity, actor, timestamp, outcome.
Run these checks before you trust anything the numbers tell you:
- Coverage — do event logs exist for every step in the workflow, or are some handoffs invisible because they happen in email or spreadsheets?
- Timestamp fidelity — are timestamps recorded at the point the activity happened, not batched and backfilled at end of day?
- Duplicate events — does the same action get logged twice by two systems, inflating activity counts?
- Missing actor IDs — can you tell who or what performed each step, including automated agents?
Integration effort varies by system age and API maturity, but governance rarely gets assigned to anyone, which is usually the bigger problem. Someone needs explicit ownership of event schema consistency across systems. Mid-market organisations name data quality and integration as the leading blockers to operational measurement, and roughly half cite data quality specifically as the barrier.
Pro Tip: Run your data quality checks on one week of historical data before you commit to a pilot. If coverage gaps or timestamp problems show up in that single week, they will show up in all thirty, and you will save yourself a month of chasing a false signal.
How do you run a 30-day throughput pilot?
You do not need an enterprise transformation programme to get a directional answer. You need one workflow, one accountable owner, and thirty to sixty days of honest event data. Here is the sequence that works.
- Pick the pilot workflow and name an owner. Choose something with clear start and end points and enough volume to be statistically meaningful. Order-to-cash, hire-to-productive, and ticket-to-resolution are common starting points because the case boundaries are unambiguous.
- Pull 30 to 60 days of event data and reconstruct the real flow. This is not the flow described in your standard operating procedure. It is the flow your systems actually recorded, complete with every loop-back and shortcut your process documentation pretends does not exist.
- Separate activity time from wait time and calculate queue depth. This single split does more diagnostic work than any other calculation in the pilot. It tells you immediately whether the problem is people working too slowly or work sitting idle.
- Identify the bottleneck candidate and validate it with the team that owns it. The data will point to a step. Bring that finding to the people who run the step before you act on it. They usually know something the data does not show.
- Simulate fixes and predict impact using historical patterns. Before you change anything live, model what happens if you remove or resource that step differently, using the same historical data you just analysed.
- Implement, monitor leading indicators, and roll forward. Fixing one constraint reveals the next one, further downstream. Plan for that from day one rather than treating the first fix as the finish line.
| Pilot stage | Typical duration | What you should see |
|---|---|---|
| Data connection and validation | 1–2 weeks | Event logs flowing with acceptable coverage and timestamp accuracy |
| Flow reconstruction and metric calculation | 1–2 weeks | Cycle time, wait time percentage and queue depth calculated for real cases |
| Bottleneck validation and simulation | 3–5 days | A named constraint agreed with the owning team, plus a modelled fix |
| Implementation and monitoring | Ongoing | Leading indicators (wait time percentage, queue depth) moving before headline metrics shift |
Enterprise-grade platforms and lightweight process-mining tools both run this same sequence. The underlying framework scales from a single spreadsheet-based pilot to a full organisational model, so a mid-market team should scope the pilot to the problem, not to the size of tooling other companies use.
Where do throughput pilots go wrong?
Most pilots that fail do not fail because the maths was wrong. They fail because the team measured the wrong symptom or trusted data that was never fit to trust.
- Misidentifying the symptom. Teams routinely blame "slow approvals" when the real issue is a queue sitting untouched for three days before anyone opens it. The activity time versus wait time split, done properly, ends this argument in one chart.
- No directional answer after 30 days. If a pilot has not produced a credible bottleneck candidate within a month, the problem is almost never the analysis. It is the event data, or nobody owns fixing it. This is the most common and most avoidable failure mode.
- Siloed data hiding the real handoff. A bottleneck between two departments is invisible if each department's system only logs its own half of the case.
- Over-relying on utilisation. A person or team running at high utilisation is not the same as a team running efficiently. High utilisation with a growing queue is often a sign of a broken upstream handoff, not proof the team is the bottleneck.
Fix these with instrumentation, not heroics: add missing event fields, correct timestamp batching at source, simplify handoffs that force manual re-entry between systems, and re-run the simulation once the data is clean.
Pro Tip: If two teams disagree about who owns a bottleneck, that disagreement is usually itself the diagnostic. Unowned handoffs are where wait time accumulates fastest.
How long until throughput measurement pays off?
Expect insight before you expect return on investment, and plan your executive reporting accordingly. Time to actionable insight typically runs two to four weeks once event data is connected and validated. The delay is almost always integration and data cleaning, not the analysis itself.
Return on investment is a longer arc. Operational execution platforms report staged capability gains at 30, 60 and 90 days, with sustained productivity improvements typically visible within several months That range reflects genuine variation by workflow complexity and how quickly a team acts on what the pilot finds, so treat it as a planning band rather than a promise.
The leading indicators worth watching in that gap between insight and ROI are wait time percentage, queue depth and rework rate. All three tend to move within weeks of a fix, well before cycle time or SLA compliance shift at the aggregate level. If those three are moving in the right direction, the headline numbers will follow. Continuous, quarterly bottleneck reviews outperform one-off projects because the constraint moves once you fix the first one, and a programme built for that creates compounding improvements over time
How does this differ from traditional cost accounting?
Traditional cost accounting allocates cost across departments, products or cost centres, usually on a monthly or quarterly cycle, and answers "what did this cost us." It is backward-looking by design, built for financial reporting rather than operational decisions, and it treats each department as a largely independent unit for reporting purposes.
Operational throughput measurement asks a different question entirely: "where is work stuck right now, and what is that costing us in flow." It works from event-level data rather than aggregated ledgers, updates continuously rather than on a reporting cycle, and deliberately looks across department boundaries because most real bottlenecks live in the handoffs between them, not inside any single team's budget line.
The two are not competitors. Cost accounting tells you where money went. Throughput measurement tells you why work is slow, and slow work is usually what drove the cost up in the first place, whether that shows up as overtime, expedited shipping, or a customer escalation that never needed to happen. Leaders who use both get the financial picture and the operational cause behind it, rather than one without the other.
What does throughput accounting look like across industries?
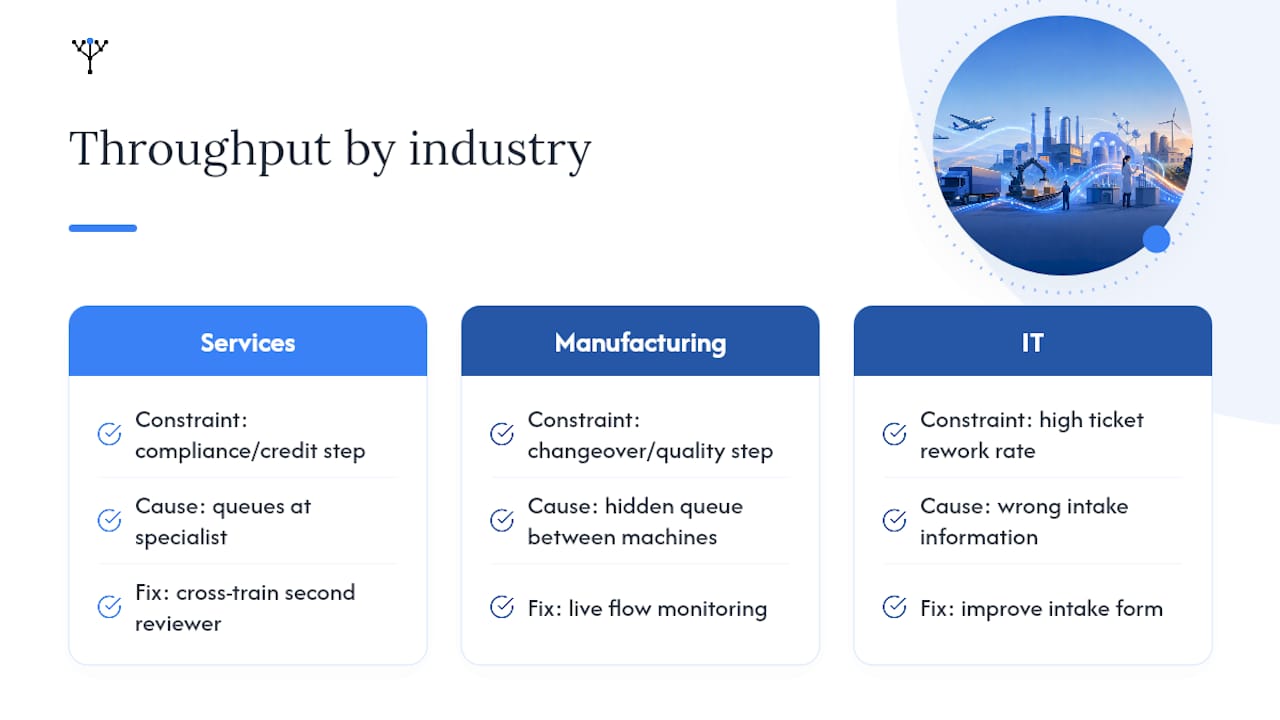
The mechanics stay consistent across sectors even though the workflows look nothing alike. A professional services firm running client onboarding will typically find its constraint in a compliance or credit check step that sits with a single specialist, creating a queue every time volume spikes. Rebuilding that flow from CRM and document-management event logs, separating activity time from wait time, and cross-training a second reviewer routinely closes most of the gap without adding headcount.
Manufacturers using production execution systems often find the constraint is not the machine everyone assumes is slow, but a changeover or quality-check step between two fast machines that creates hidden queue depth. Production operations platforms report meaningful gains once live monitoring replaces end-of-shift reporting, because the delay becomes visible in near real time instead of showing up as a missed target the next morning.
In IT service management, rework rate is often the most revealing metric: tickets that bounce between tiers because the wrong information was captured at intake. Fixing the intake form, not adding more resolvers, is frequently the higher-leverage move.
Across all three, the pattern holds: mid-market organisations rarely need a bigger team. They need to see the flow they already have.
What role does software and automation play?
Software earns its place here by doing two things well: reconstructing flow from event data faster than a human analyst could, and acting on findings faster than a manual handoff ever would. Process-mining tools handle the first job, turning raw logs from CRM, ERP and ITSM systems into a visual, timestamped map of how cases actually travel.
The more advanced layer is automated remediation. Self-healing workflows can detect and correct certain issues automatically, rerouting work or quarantining bad records without a human in the loop, cutting resolution time from hours or days down to seconds for workflows suited to it. That suitability matters: anything requiring a full regulatory audit trail is a poor fit for full automation, and that caution applies whether the workflow is a financial approval or a clinical record, not just the obvious regulated cases.
For teams looking to automate the repetitive parts of accounting workflows specifically, there is dedicated guidance on accounting workflow automation worth reviewing before you decide how much to automate versus monitor. The right amount of automation depends entirely on how tolerant the workflow is of an error slipping through unreviewed, not on how impressive the automation sounds in a vendor demo.
How should throughput insights shape strategy?
A bottleneck finding is only useful if it changes a decision above the workflow level, not just within it. That means routing findings into whatever planning cycle your organisation already runs, whether that is quarterly OKRs, an annual strategy review, or a rolling continuous-improvement programme built on Lean or Kaizen principles.
The practical link is resourcing. If queue depth analysis shows a specific step consistently constrains three different revenue-generating workflows, that is a stronger case for headcount or system investment than any departmental request built on utilisation numbers alone. Throughput data gives finance and operations leaders a shared, event-level basis for that argument instead of competing anecdotes.
The same data should feed governance, not just budgeting. Assign explicit ownership for maintaining event log quality as workflows change, because a strategy built on a live organisational model degrades the moment nobody keeps the underlying data current. Treat the pilot playbook as a repeatable capability, not a one-off project, and each cycle should surface the next constraint rather than declaring victory on the first fix.
What surprises leaders most about throughput accounting?
The pattern I see most consistently is that leaders are rarely surprised by which step is slow. They are surprised by how much of the delay was invisible until the event data forced it into view. Wait time percentage is usually the number that changes the conversation in a leadership meeting, not cycle time.
Data quality is the recurring obstacle, and it is rarely dramatic. It is a missing actor ID here, a batched timestamp there, quietly making the whole picture unreliable. Hidden process variants show up almost every time too: the workflow three different teams believe they run turns out to be five different workflows once the logs are honest about it.
In week one, watch wait time percentage above anything else. It moves first and it is the clearest early signal that a fix is working before the headline metrics catch up. The governance question worth resolving immediately is simple: who owns event schema consistency when a system changes? Leave that unanswered and the model degrades within a quarter. Readers wanting the mechanics of bottleneck validation in more depth should see Oak & Nine's guide to finding the bottleneck in a process.
— Ronan
How Oak & Nine helps you operationalise this
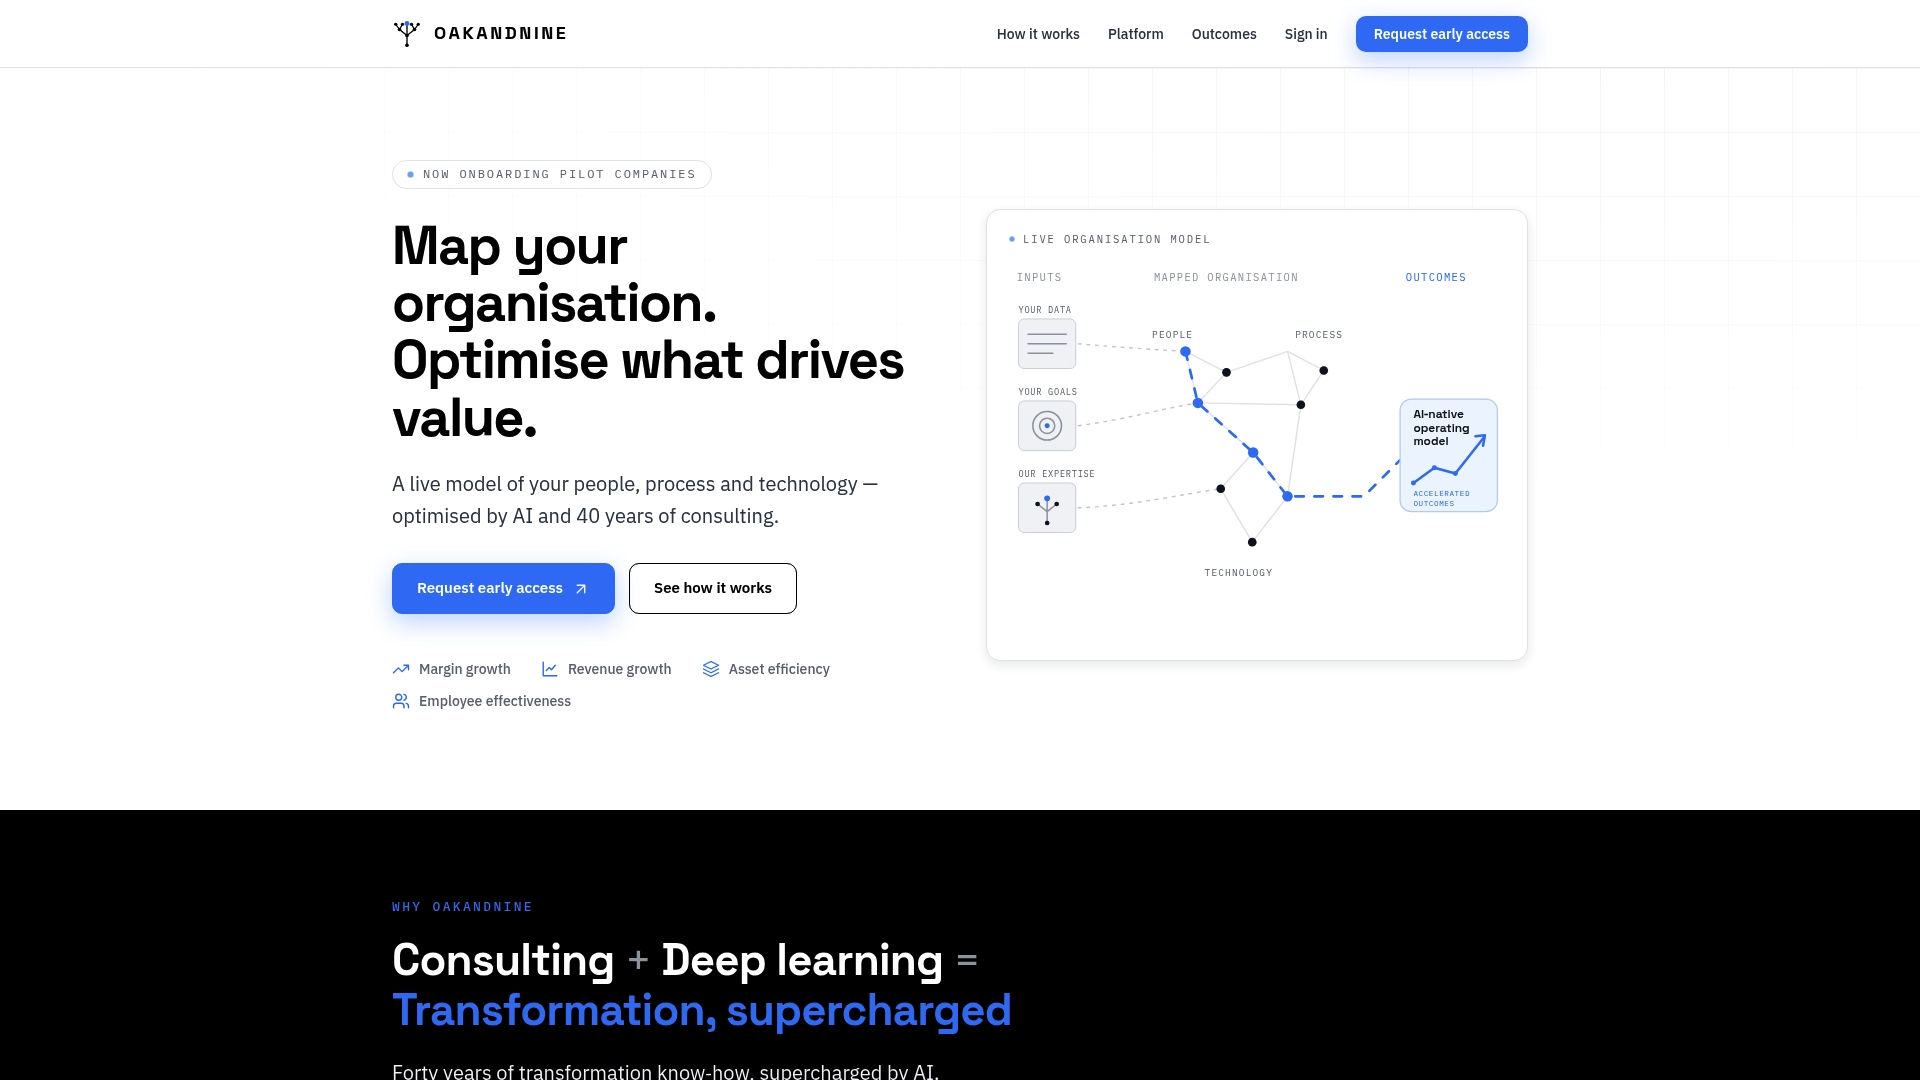
Everything covered above depends on one thing most organisations lack: a live, connected view of how work actually moves across CRM, ERP, ITSM and production systems at once. Oakandnine builds exactly that. The platform unifies event data from across your departments into a single organisational model, automatically surfacing bottleneck candidates, wait time patterns and resource allocation gaps as they happen, rather than weeks after a report gets compiled.
For operations leaders specifically, that means the six-step pilot playbook above stops being a manual quarterly exercise and becomes something the platform runs continuously, flagging the next constraint before it costs you a missed SLA. If you are ready to see what a live model of your own organisation would surface, visit the operations leaders page to arrange a walkthrough with your own workflow data.
Sources
For readers who want to go deeper on specific parts of this playbook:
- AI Workflow Optimization: Finding and Fixing Bottlenecks | Zarif Automates
- ERP AI Adoption Report 2026: Mid‑Market Benchmarks - KORE1