
The employee productivity formula is: Productivity = Total output ÷ Total input. A UK mid-market service firm produces significant revenue per employee, establishing a practical baseline for improvement conversations. That single figure is your baseline. Pick one team, compute it this week, and you have the foundation for every improvement conversation that follows.
Table of Contents
- What does the employee productivity formula actually measure?
- Which productivity metric fits your team?
- How to calculate team productivity: a step-by-step worked example
- How to interpret results and avoid measurement traps
- How AI and an integrated operating model change what you can measure
- What timeline and costs should you expect as a mid-market UK firm?
- Quick checklist: data to collect and questions to ask
- Key takeaways
- Why an integrated model beats siloed metrics every time
- Oakandnine helps you baseline, pilot, and protect your gains
- Sources and further reading
What does the employee productivity formula actually measure?
Before you calculate anything, you need clean definitions. Output and input mean different things depending on your function, and conflating them is where most mid-market measurement efforts collapse.
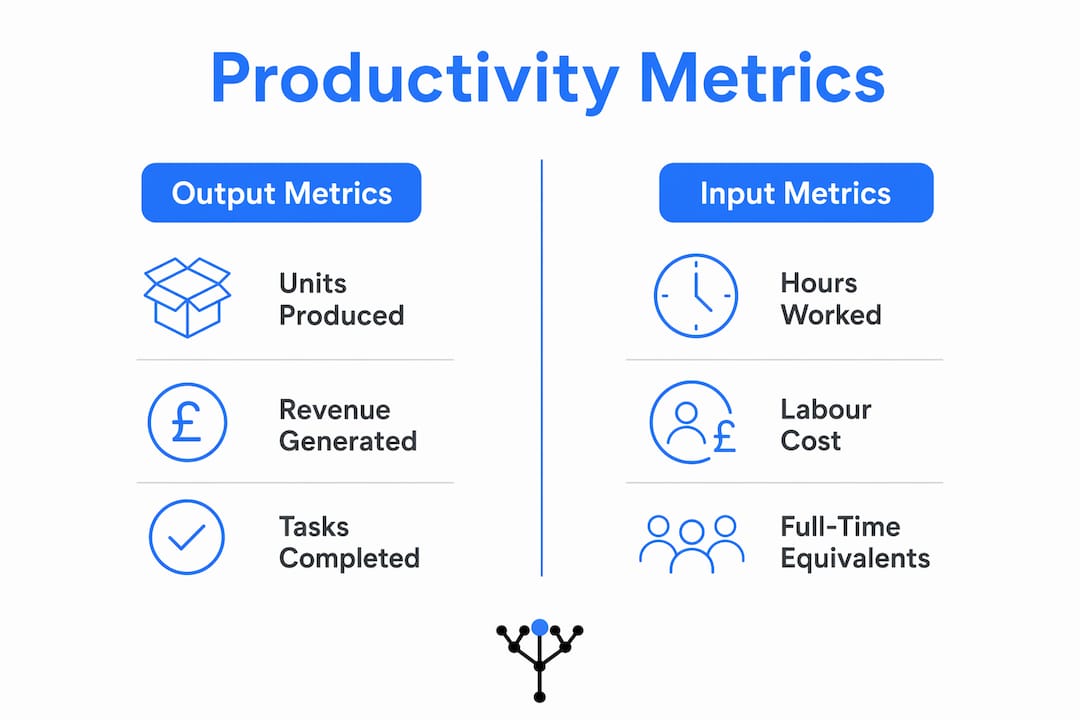
Output is the value or volume your team produces in a given period:
- Sales: revenue closed, pipeline converted, contract value
- Customer support: tickets resolved, first-contact resolution rate
- Operations/production: units shipped, orders fulfilled
- Back office: reports delivered, processes completed
Input is what you consumed to produce that output. Three variants are in common use, and the right choice depends on your data quality:
- Hours worked: most granular; requires reliable timesheet or HRIS data
- Headcount/FTE: quickest to pull from payroll; useful for cross-team benchmarking
- Total labour cost: includes salaries, benefits, and on-costs; best for margin analysis
Your data sources map directly to these definitions. Finance systems hold revenue and labour cost. Your HRIS carries FTE and role data. CRM and production logs surface volume metrics. Timesheets, where they exist, give you hours. The reliability of each source varies: finance data tends to be clean; timesheet data is often incomplete for knowledge workers, where off-platform strategic work goes entirely unrecorded.
Which productivity metric fits your team?
No single variant works for every function. The table below maps the most common metrics to their best-fit contexts.
| Metric | Formula | Best for | Watch out for |
|---|---|---|---|
| Labour productivity | Output ÷ Hours worked | Manufacturing, support, ops | Requires accurate timesheets |
| Revenue per employee | Total revenue ÷ FTE | Cross-team benchmarking, board reporting | Distorted by team mix or pricing changes |
| Output per hour | Units ÷ Hours worked | Production, fulfilment | Ignores quality and rework |
| Multifactor productivity | Output ÷ (Labour + capital + materials) | Capital-intensive operations | Data-heavy; harder to maintain |
| Quality-adjusted output | (Output × quality score) ÷ Input | Support, professional services | Requires a reliable quality signal |
A few practical pointers on choosing:
- Sales teams: revenue per employee is board-ready and easy to defend; pair it with win-rate to catch quality degradation.
- Operations and fulfilment: output per hour surfaces shift-level inefficiency quickly.
- Support functions: quality-adjusted output prevents the productivity paradox where rushing calls creates repeat contacts and destroys net efficiency.
- Back office: multifactor productivity is theoretically superior but often impractical; revenue per FTE is a reasonable proxy.
How to calculate team productivity: a step-by-step worked example
Follow this sequence with your finance and HR leads. It takes roughly two to four weeks to gather clean data for a first baseline.
- Choose your scope. Pick one team or function. Cross-functional pilots dilute the signal.
- Define your output measure. Select one primary metric (revenue, units, tickets resolved). Resist the temptation to aggregate multiple outputs before you have a baseline.
- Define your input. Decide between hours, FTE, or labour cost based on data availability.
- Collect and reconcile data. Pull from finance, HRIS, and CRM for the same period. Check for part-time FTE adjustments and exclude non-productive leave from hours where possible.
- Compute the ratio. Divide output by input.
- Normalise. Express the result per FTE or per hour so it is comparable across periods and teams.
Worked example — UK mid-market customer operations team:
- Team size: 18 FTE
- Tickets resolved in Q1: 9,720
- Total hours logged: 5,400
- Output per hour: 9,720 ÷ 5,400 = 1.8 tickets per hour
- Output per FTE: 9,720 ÷ 18 = 540 tickets per FTE per quarter
Now run the same calculation for Q2 after a process change. If output per hour rises to 2.1, that is a 16.7% improvement. If it stays flat but rework rate drops, your quality-adjusted figure will tell a better story than the raw ratio.
For operational efficiency gains to show up in the numbers, your data reconciliation must be consistent. The most common error is comparing periods with different leave exclusions or FTE counts.

How to interpret results and avoid measurement traps
Numbers without context mislead. Three traps catch mid-market leaders most often.
Activity theatre is the most pervasive. Measuring message counts, email volume, or logged hours rewards presence, not output. Idle time and unproductive active time are distinct categories, and conflating them with productive output produces a flattering but false picture.
The productivity paradox hits support and sales teams hardest. Maximising call volume or ticket throughput without a quality gate generates repeat contacts, rework, and customer friction. Net efficiency falls even as the raw ratio climbs.
Hidden work is the blind spot for knowledge-intensive roles. Strategic analysis, relationship management, and mentoring rarely appear in tracked systems. Complement timesheet data with outcome-based measures and manager-verified examples of value.
Qualitative factors to pair with every quantitative metric:
- Employee engagement scores (top-quartile engaged teams outperform disengaged peers by roughly 18% on output and 23% on profitability)
- Rework and error rates
- Customer satisfaction and first-contact resolution
- Voluntary attrition, which signals unsustainable pace before it shows up in output
Pro Tip: Set benchmarks at the role level, not the team level. Top performers often show different break and focus patterns than median performers. A single team-wide target will either under-challenge your best people or demoralise the rest.
Seasonal adjustment matters too. A Q4 spike in a retail operations team is not a productivity gain; it is volume. Normalise by period and by FTE before drawing conclusions.
How AI and an integrated operating model change what you can measure
Context switching can consume up to 40% of productive time, and interruptions occur roughly every two minutes during core hours. AI does not fix that by making people faster. It fixes it by removing the low-value work that causes the switching in the first place.
Practical AI use cases for mid-market measurement and improvement:
- Automated data unification: pulling finance, HRIS, CRM, and production data into a single model without manual reconciliation
- Anomaly detection: flagging when a team's output-per-hour drops outside normal variance before it becomes a quarterly problem
- Time-allocation inference: estimating where hours are actually going when timesheet compliance is low
- Task automation: removing repetitive processing so capacity is freed for higher-value work
- Capacity forecasting: projecting where bottlenecks will emerge before they constrain output
The critical question is not whether AI frees time. It usually does. The question is where that freed time goes. Organisations that lack an integrated operating model see gains reabsorbed into meetings, messages, and coordination overhead rather than redirected to higher-value work. Instrumenting both the input reduction and the destination of freed capacity is what separates a genuine productivity gain from a temporary efficiency blip.
An integrated operating model connects people, processes, and technology in a live view of how work actually flows. Without that connective tissue, AI-led gains fragment back into the silos they came from. Oakandnine's platform builds that live model, ties data to process, and makes freed capacity visible so leaders can protect and redirect it deliberately.
Pro Tip: Track time spent in AI tools such as ChatGPT, Gemini, or Claude alongside your output metrics. AI tool usage benchmarks are now measurable and can contextualise whether AI adoption is translating into output gains or simply adding another application to the context-switching load.
For a practical view of how automated reporting fits into this model, the partner resource linked here covers the consulting workflow angle well.
What timeline and costs should you expect as a mid-market UK firm?
| Phase | Duration | What 'meaningful gain' looks like |
|---|---|---|
| Baseline | 2–4 weeks | Clean output/input ratio for one team; data gaps identified |
| Pilot | 6–8 weeks | 10–20% improvement in target metric; freed capacity quantified |
| Scale | 3–9 months | Gains replicated across functions; operating model updated |
Major cost drivers to budget for:
- Data engineering: connecting and cleaning HRIS, finance, CRM, and production sources
- Integration: API connectors or middleware between systems
- Change management: the most underestimated line item; adoption determines whether gains hold
- Licence or subscription: platform and tooling costs
- Coaching: helping team leads interpret metrics and act on them without creating surveillance culture
Sizing a pilot: one team, one output metric, one input measure, six to eight weeks. That is enough to validate the data model and produce a defensible ROI case for the board. For change management considerations specific to mid-market deployments, the linked guide covers adoption patterns in detail.
Quick checklist: data to collect and questions to ask
Data to collect before you start:
- Finance: revenue by team or function, payroll cost, labour on-costs
- HR/HRIS: FTE by role, part-time adjustments, leave data
- CRM or production logs: volume metrics aligned to your chosen output measure
- Time-tracking or timesheets: hours by team, with leave excluded
- Quality signals: error rates, rework logs, customer satisfaction scores
Questions to ask a vendor or consultant:
- What data sources do you connect to, and do you have existing connectors for our HRIS and finance system?
- Who owns the data model after the engagement ends?
- Can you show a sample deliverable from a comparable mid-market deployment?
- How do you handle data security and UK data protection obligations?
- What evidence do you have of sustained productivity gains, not just pilot-stage improvements?
Vendor readiness signals: pre-built connectors to common UK mid-market systems, configurable metric definitions, explicit change management and coaching capability, and a clear data ownership model post-engagement. For a detailed view of system integration patterns relevant to UK mid-market stacks, the linked guide is a practical starting point.
Key takeaways
The most effective approach to measuring and improving employee productivity is to pair a clean quantitative formula with qualitative signals, then use an integrated operating model to protect the capacity AI frees.
| Point | Details |
|---|---|
| Start with one team | Pick a single scope, define one output and one input, and baseline before changing anything. |
| Pair metrics with quality signals | Engaged teams outperform disengaged peers by roughly 18% on output and achieve 23% higher profitability; raw output ratios miss this entirely. |
| Protect freed capacity | AI gains are reabsorbed without a live operating model tracking where time is redirected. |
| Budget for change management | Data engineering and integration are visible costs; adoption coaching is where pilots fail silently. |
| Oakandnine for data unification | Oakandnine's live organisational model connects your data sources and makes freed capacity visible for deliberate redeployment. |
Why an integrated model beats siloed metrics every time
The conventional wisdom says you need better dashboards. You do not. You need a better model of how work flows through your organisation, and dashboards are only useful once that model exists.
Every mid-market firm I have worked with has the data. It sits in finance, HRIS, CRM, and production systems, disconnected and unreconciled. The productivity formula is trivial arithmetic once the data is clean. The hard work is building the operating model that keeps it clean, surfaces the right signals in real time, and connects measurement to action. That is where Oakandnine's approach differs from a standard analytics project: we build the live model first, then the metrics follow from it rather than preceding it. Governance and employee-centred measurement are not afterthoughts in that model. They are structural requirements, because a metric that erodes trust destroys the engagement that drives the output you are trying to measure.
Oakandnine helps you baseline, pilot, and protect your gains
Mid-market productivity programmes stall for one reason: the data is scattered, the model is missing, and freed capacity gets reabsorbed before anyone notices. Oakandnine addresses that directly.
Working with Oakandnine, you get a rapid baseline and pilot scoped to one team in six to eight weeks, AI-driven data unification that connects your finance, HRIS, CRM, and production systems into a single live model, and coaching that helps your team leads protect and redirect freed capacity rather than let it dissolve into coordination overhead. Pilot outcomes typically include a clean output/input ratio, identified friction points, and a quantified capacity opportunity the board can act on.
To start a pilot or request a working session, speak to the Oakandnine team directly.
Sources and further reading
- Employee Productivity Formula: Methods, Examples, and Tips — Everhour
- How is Productivity Measured? — U.S. Bureau of Labor Statistics
- Employee Productivity Statistics 2026: Data, Benchmarks & Trends — Rewordin
- 2026 Productivity & Engagement Benchmarks — Time Doctor
- Employee Productivity: Your 5-Step Plan — 2020Onsite
- Top Employee Productivity Statistics & Trends — Management.org
- How to increase employee productivity: a manager's guide — Oakandnine
- Employee engagement strategies for HR leaders — Oakandnine
- Workflow automation software: a 2026 guide for managers — Oakandnine