
Cost to serve (CTS) measures the full end-to-end cost of serving a specific customer, product or channel, and it usually reveals which accounts quietly destroy margin. The verdict most operations leaders reach after their first proper CTS exercise is uncomfortable: a good chunk of "growth" revenue costs more to fulfil than it earns. Recognised model forms range from simple aggregate allocation to time-driven activity-based costing (TDABC), and the right one depends on how mature your data already is.
Run the analysis properly and it delivers three things almost immediately:
- Exposes unprofitable relationships hiding inside apparently healthy revenue lines.
- Informs pricing and contract terms with real cost evidence instead of guesswork.
- Optimises service design by matching service levels to what customers actually cost to support.
Key Takeaways
Cost to serve analysis works because it attributes real operational and service costs to individual customers and products, exposing profitability that gross margin conceals.
| Point | Details |
|---|---|
| Definition matters | CTS goes beyond gross margin by attributing indirect and operational costs to customers or products. |
| Expect unprofitable accounts | Between 20% and 40% of customers may be unprofitable once activity-based costs are properly allocated. |
| Master data is the constraint | Data quality and master-data design limit CTS accuracy more than modelling sophistication does. |
| Run it as a pilot | Follow a six-step workflow starting with a scoped pilot, not an enterprise-wide rollout. |
| Sustain it with connected data | Platforms like Oakandnine keep the model current by integrating finance, HR and operations data automatically. |
Table of Contents
- What is cost to serve analysis and how does it differ from gross margin?
- Why does cost-to-serve analysis matter for profitability?
- What data and master data does cost to serve calculation require?
- How do you calculate cost to serve step by step?
- Which modelling approach fits your business: spreadsheet, TDABC or network model?
- How do you turn cost-to-serve results into pricing and segmentation decisions?
- What are the common pitfalls in cost-to-serve projects?
- How Oak & Nine keeps cost-to-serve current instead of stale
- Where has cost to serve analysis exposed unprofitable customers or products?
- What software supports cost to serve analysis?
- How does cost to serve analysis connect with wider business systems?
- How does cost-to-serve analysis differ by industry?
- What the conventional cost-to-serve playbook gets wrong
- Make cost-to-serve a permanent capability, not a project
- Sources
What is cost to serve analysis and how does it differ from gross margin?
Gross margin tells you revenue minus cost of goods sold. It says nothing about the freight surcharges, the returns processing, the rush orders, or the account manager hours a particular customer consumes. Cost to serve analysis fills that gap by attributing indirect, operational and service costs down to the level of a customer, order, product line or channel. Two customers can carry identical gross margin and wildly different actual profitability once you factor in how they order, how often they return goods, and how much support they demand.
Activity-based costing (ABC) is the parent methodology: it assigns overhead costs to activities, then to the products or customers that consume those activities, rather than spreading overhead as a flat percentage. Time-driven activity-based costing (TDABC) refines this by using time as the primary driver, estimating how long each activity takes and multiplying by a cost rate per time unit. It tends to suit businesses with variable order complexity, such as distributors juggling small and large accounts side by side.
Choosing between a simpler aggregate CTS model and full TDABC comes down to data maturity and scale. If your transactional systems are patchy, start aggregate. If you already capture pick times, delivery windows and support-ticket durations, TDABC will pay for itself faster.
Why does cost-to-serve analysis matter for profitability?
CTS answers questions that standard financial reporting cannot: which customers should we renegotiate, which service tiers are underpriced, and which product lines survive only because nobody has costed the returns processing behind them. Finance gets a defensible allocation model instead of arbitrary overhead spreading. Operations gets evidence for where service levels are mismatched to value. Sales gets ammunition for contract renewals that previously relied on instinct.
The scale of the problem tends to surprise leadership teams. Industry studies indicate a substantial share of customers may be unprofitable once indirect and activity-based costs are properly allocated rather than smoothed across the customer base. That is not a rounding error. It is often a fifth to two-fifths of your customer file quietly subsidised by the rest.
CTS typically resolves three recurring business questions:
- Which accounts need a price increase, a minimum order value, or a service downgrade?
- Which product lines carry hidden fulfilment or returns costs that erase their apparent margin?
- Where should the next investment in automation or process redesign actually go?
What data and master data does cost to serve calculation require?
The single biggest constraint on CTS accuracy is not modelling sophistication. It is data quality and master-data design, a point IMD's research on cost-to-serve makes forcefully: firms that skip master-data discipline end up with a model nobody trusts. Deloitte's advisory work on cost to serve groups the required inputs into five categories, and missing any one of them weakens the whole picture.
- Financial data — general ledger costs by department, freight invoices, warehouse overhead, and support-team salaries.
- Operational data — pick and pack times, delivery routes, inventory days held, and return-processing hours.
- Transactional data — order volumes, order lines, order frequency, and split-shipment patterns by customer.
- Product data — weight, dimensions, storage requirements, and any product-specific handling rules.
- Customer and channel data — order channel, account tier, contract terms, and support-ticket history.
Granularity is a judgement call, not a virtue in itself. Modelling every SKU-level movement across a 50,000-line catalogue will bury a pilot before it starts. Aggregate similar products into handling categories, and aggregate small accounts into cohorts by order pattern rather than costing each one individually. Save the fine detail for the accounts and product lines your initial results flag as worth investigating further.
For a pilot, keep the scope tight: one quarter of transactional data, one product category or customer segment, and named owners from finance and operations who can sign off on the cost drivers used.
Pro Tip: Nominate a single "data owner" per source system before the pilot starts. Cost-to-serve projects stall most often because three departments each assume someone else is cleansing the freight file.
How do you calculate cost to serve step by step?
Gartner recommends a six-step model for supply chain leaders building a sustainable cost-to-serve capability, and it adapts well into a pilot workflow that operations teams can run without a six-month consulting engagement.
- Map cost components and agree scope. Pick one product line, region or customer segment where a clear commercial decision is waiting. Gartner's own guidance stresses phased pilots over enterprise-wide rollouts, since a decision-driven scope keeps the project fundable when results start to land.
- Map activities to drivers and cost elements. List the discrete activities involved in serving a customer, from order intake through delivery and returns, and identify what drives the cost of each one, whether that is order lines, delivery stops, or support calls.
- Collect, cleanse and align data. Pull the financial, operational and transactional inputs identified earlier, reconcile them to a consistent time period, and resolve any obvious data gaps before modelling starts. A single quarter is usually enough to establish a pattern.
- Quantify cost per activity and attribute it to transactions. Calculate a cost rate for each activity, then apply that rate to every order or transaction based on how much of the activity it consumed.
- Aggregate to customer or product level and build profit profiles. Roll the transaction-level costs up to the customer, product line or channel, and subtract from net revenue to produce a genuine profitability figure, not a gross-margin proxy.
- Define decisions, pilot changes, and measure impact. Use the output to make a specific change, whether that is a minimum order value, a price adjustment, or a service-tier reassignment, then track whether margin actually moves before scaling the model further.
Successful rollouts tend to share a structural feature: a cross-functional steering group with finance, operations and commercial representation, a small set of pilot KPIs covering model accuracy, time to insight and margin impact, and roughly a two-quarter horizon for implementation and measurement. Skip the steering group and the model becomes finance's pet project that operations quietly ignores.
Which modelling approach fits your business: spreadsheet, TDABC or network model?
Not every business needs the same level of modelling sophistication, and matching the approach to your resources matters more than chasing the most advanced option available.
- Spreadsheet or proxy models suit a first pass. They are cheap, fast to build, and good enough to identify obviously unprofitable segments before you invest further.
- TDABC works well once you have reliable time-per-activity data, or can estimate it credibly, since it assigns operational time costs to specific activities and then to customers with more precision than flat allocation.
- Network or dynamic models support scenario testing, letting you simulate the effect of a warehouse consolidation or a new delivery lane before committing to it, but they need proper automation to stay current, since manually rebuilding a network model each quarter is rarely sustainable.
The honest trade-off is maintenance cost. A spreadsheet model degrades the moment nobody updates it. A network model degrades faster still unless it draws on live transactional feeds rather than a quarterly data dump.
How do you turn cost-to-serve results into pricing and segmentation decisions?
The classic output of a CTS project is a "whale curve": customers ranked by cumulative profitability, which typically shows a long tail of loss-making accounts dragging down profit generated by a much smaller group at the top. Seeing that curve for the first time tends to change how a commercial team talks about "growth" accounts.
From there, the practical moves fall into a handful of categories:
- Price review for customers whose service demands exceed what their contract currently covers.
- Service-tier redesign, matching delivery frequency, support access and return allowances to what each tier actually costs to deliver, an approach that pairs well with broader segment alternatives for mid-market operations.
- Minimum order values or surcharges for small, high-frequency orders that generate disproportionate handling cost.
- Contract renegotiation using CTS figures as the evidence base, rather than a generic price increase applied across the board. Pricing-strategy specialists such as AMAUTA Public Affairs note that stakeholder communication matters as much as the number itself when changing terms with long-standing accounts.
Case evidence from CTS projects consistently shows recoverable margin once decisions are acted upon, whether through portfolio rationalisation or targeted price changes on the worst-performing accounts. The output is only as valuable as the decision it triggers, though. A whale curve sitting in a slide deck changes nothing.
| Point | Details |
|---|---|
| Rank customers by profitability | Build the whale curve first; it identifies where to focus commercial attention. |
| Match service to value | Redesign tiers so delivery frequency and support access reflect actual cost to serve. |
| Use CTS in renegotiation | Bring cost evidence into contract discussions instead of relying on standard rate increases. |
What are the common pitfalls in cost-to-serve projects?
Scope creep kills more CTS initiatives than bad data does. Teams start with one product category, then someone asks "what about the whole catalogue", and six months later there is still no output because the model tries to answer everything at once. That is paralysis by analysis, and IMD's guidance on master-data design points squarely at over-engineered granularity as the usual cause.
The fix is structural, not just disciplinary:
- Keep pilots narrow and resist expanding scope until the first cycle delivers a decision.
- Assign clear roles: finance owns cost allocation logic, operations owns activity and time data, commercial owns the resulting decisions.
- Set an update cadence, whether quarterly or aligned to your financial close, with version control so nobody argues about which model is current.
- Define simple acceptance criteria for accuracy, such as reconciling model output to actual departmental cost within an agreed tolerance.
Pro Tip: Write your acceptance criteria before you build the model, not after. Teams that define "good enough" in advance ship pilots twice as fast as those debating precision after the numbers are already on the table.
How Oak & Nine keeps cost-to-serve current instead of stale
Most cost-to-serve projects die the same way: someone builds a brilliant model in a spreadsheet, presents it once, and then nobody updates it because pulling fresh data from four disconnected systems takes a week each time. That is a data-architecture problem before it is an analytics problem.
Oakandnine's platform addresses the underlying issue by connecting HR, finance and operations master data into a single live model of the organisation, which removes much of the manual reconciliation that normally precedes a CTS refresh. Real-time insights and preemptive alerts mean cost drivers, such as a sudden spike in returns processing or a lane where freight costs have crept up, surface before they distort a quarter's results. Automating the routine data assembly frees analysts to spend their time interpreting the profit profiles rather than chasing spreadsheet updates.
A cost-to-serve model is only as useful as its last refresh. Connect the source systems once, and the analysis stays alive instead of expiring the moment someone changes a delivery route.
Explore how connecting the functions behind a CTS model changes what your finance and operations teams can actually see.
Where has cost to serve analysis exposed unprofitable customers or products?
The pattern recurs across sectors even though the details differ. A distributor discovers that its smallest, most demanding accounts, ones placing frequent low-value orders with next-day delivery expectations, cost more in pick, pack and delivery time than the margin they generate. A manufacturer finds that a "flagship" product line only looks profitable because its returns-processing cost was never separated out from general warehouse overhead; once isolated, the line barely breaks even.

Retailers running omnichannel operations often uncover a subtler version of the same problem: online orders fulfilled from store stock carry a hidden picking cost that never shows up in the channel's reported margin, because the labour was already on the store's payroll for other reasons. CTS analysis forces that cost into the open.
Case summaries from cost-to-serve implementations report recoverable margin once these findings translate into action, typically through targeted pricing changes, minimum order thresholds, or a decision to discontinue a product variant that never earned its keep. The common thread is not that unprofitable customers or products are rare exceptions. It is that they hide comfortably inside aggregated financial reporting until someone builds the model that separates them out.
The lesson for a pilot team is straightforward: pick the segment where you already suspect a problem exists. CTS rarely surprises leadership about which accounts are difficult. It surprises them about how much that difficulty actually costs.
What software supports cost to serve analysis?
Spreadsheets remain the entry point for most first-pass CTS work, and there is nothing wrong with that for a scoped pilot. The limitations show up at scale: a spreadsheet model struggles to consume live ERP feeds, breaks under version-control chaos when three analysts edit it simultaneously, and cannot easily support scenario testing across multiple variables.
Calculation engines that consume ERP and transactional data directly solve the scale problem by automating the data pull and letting analysts focus on interpretation rather than assembly. These tools typically offer dynamic reporting down to transaction level, which matters once a business wants to move from a one-off diagnostic to an ongoing management tool.
The category splits into three practical tiers. Entry-level field apps and spreadsheet templates suit a single-category pilot with modest data volumes. Mid-tier calculation engines connect to ERP and warehouse-management systems to automate the cost-per-activity math, useful once a business commits to running CTS quarterly rather than as a one-off project. Enterprise platforms integrate cost-to-serve modelling with broader organisational data, financial planning, HR capacity, and operational workflows, which matters most for businesses that want CTS findings to trigger action automatically rather than sit in a report.
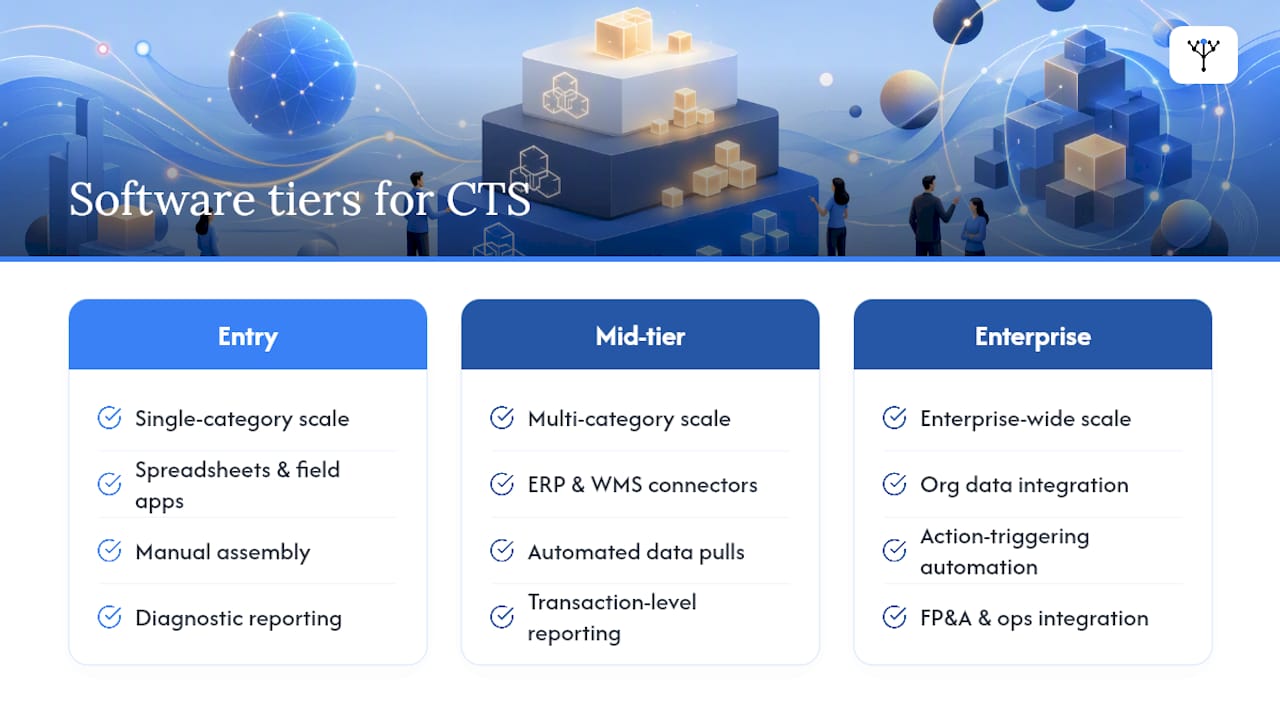
Choosing between tiers depends less on company size than on how often you intend to refresh the model. A business running CTS once a year can manage with spreadsheets. A business trying to reprice accounts every quarter needs automation, because manual data assembly simply cannot keep pace with that cadence.
How does cost to serve analysis connect with wider business systems?
CTS analysis rarely stays useful in isolation. Its real value emerges when it feeds, and is fed by, the systems finance and operations already rely on. Financial planning and analysis teams need CTS output to sharpen customer-level forecasts rather than relying on blended margin assumptions. Sales and CRM systems benefit from CTS flags that identify which renewing accounts need a pricing conversation before the contract auto-renews on old terms.
The integration challenge is largely a master-data one. If customer identifiers differ between your CRM, ERP and warehouse-management system, reconciling cost-to-serve output against sales pipeline data becomes a manual exercise every single cycle. Firms that solve this once, by unifying identifiers and definitions across systems, find that CTS reporting stays synchronised with financial close rather than lagging behind it by weeks.
There is also a natural link to broader operational efficiency work: a CTS model that flags high-cost fulfilment routes is, in effect, pointing at the same bottlenecks that process-improvement initiatives target. Treating the two as separate projects wastes effort. A business already running process optimisation initiatives should feed CTS output directly into that prioritisation, since the highest-cost activities identified by one exercise are usually the same ones worth redesigning in the other.
The practical takeaway: before building a standalone CTS model, check what identifiers and definitions your finance, CRM and operational systems already share. Fixing misalignment there saves more time than any modelling refinement.
How does cost-to-serve analysis differ by industry?
The core method holds across sectors, but the cost drivers that dominate the model shift considerably depending on what you sell and how you deliver it.
Distribution and wholesale businesses tend to find that order frequency and delivery-drop density dominate the cost picture, since small, frequent orders to dispersed locations are expensive regardless of order value. Manufacturing businesses often discover that returns processing and quality-related rework carry more hidden cost than logistics, particularly where custom or configured products generate disproportionate after-sales support.
Retail and omnichannel operators face a distinctive challenge: allocating shared labour and inventory costs across channels that draw from the same stock pool, which requires more careful activity mapping than a single-channel business needs. Subscription and SaaS businesses apply cost-to-serve thinking slightly differently, focusing on support-ticket volume, onboarding time and infrastructure consumption per account rather than physical fulfilment, and the resulting profitability view interacts closely with retention and churn analysis, since an unprofitable account and a churn-risk account are often the same customer.
Professional services firms, meanwhile, need to attribute billable and non-billable time to specific client relationships, which functions much like TDABC applied to people rather than warehouses. Whichever sector you sit in, the adaptation is the same: keep the six-step framework intact, but let the industry dictate which activities and drivers deserve the most granular attention.
What the conventional cost-to-serve playbook gets wrong
Most advice on cost-to-serve analysis treats it as a one-off diagnostic exercise: build the model, present the whale curve, watch heads nod, move on. That framing is the reason so many CTS projects deliver a memorable slide and no lasting change. The research is consistent on this point: the businesses that recover margin are the ones that turn CTS into a repeatable cycle with named owners and an update cadence, not the ones that produce the most sophisticated model.
The conventional advice also over-indexes on modelling technique, TDABC versus network models versus spreadsheets, when the actual bottleneck is almost always master-data alignment. A mediocre model built on clean, unified customer and product identifiers beats an elegant model rebuilt from scratch every quarter because nobody can agree which customer ID belongs to which order.
If you take one thing from this, prioritise the plumbing before the modelling. Fix how your systems identify customers and products, agree who owns each data source, and only then decide whether you need TDABC or a spreadsheet will do.
— Ronan
Make cost-to-serve a permanent capability, not a project
Oakandnine is the alternative to running cost-to-serve as a one-off consulting engagement: instead of a static model that goes stale the moment your systems change, you get a live organisational data platform that keeps finance, HR and operations information connected and current.
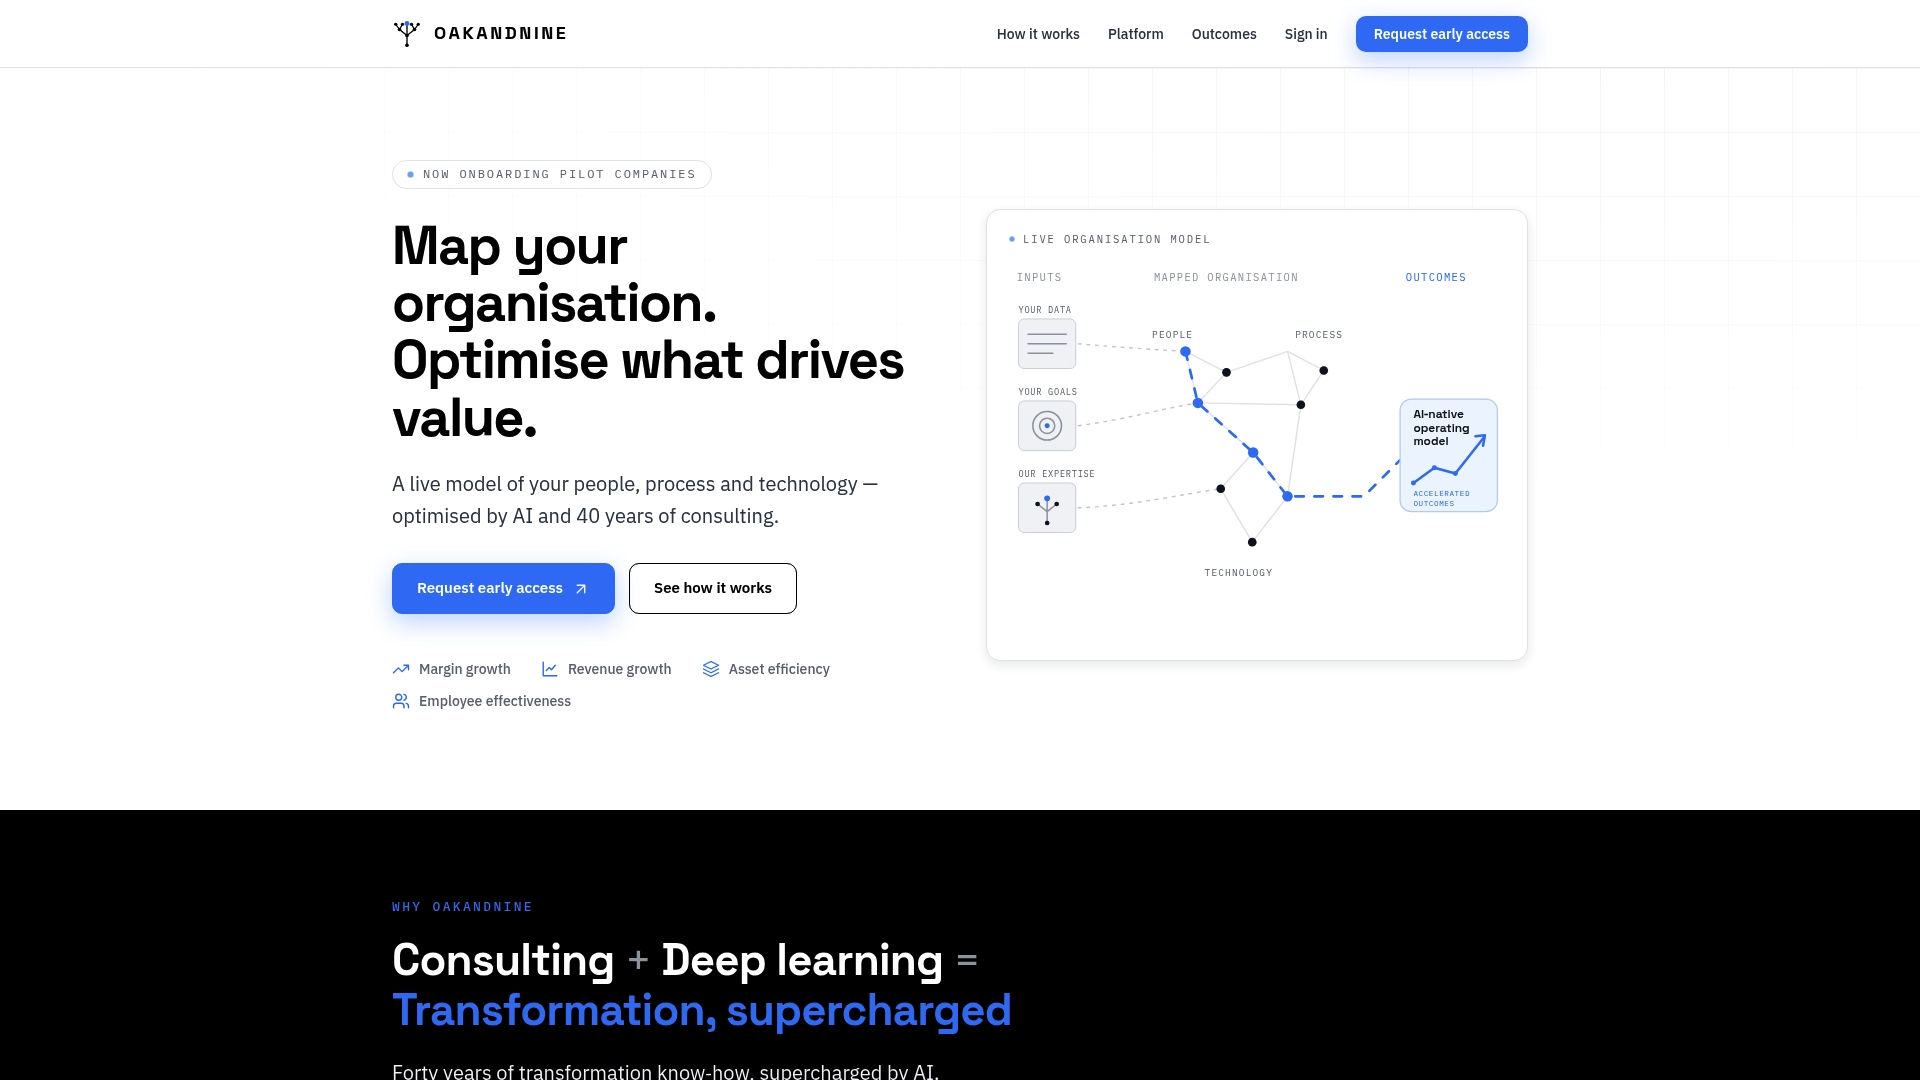
That matters because the biggest threat to any CTS initiative is not the maths. It is the six-week delay every quarter spent chasing data from disconnected systems before anyone can even start the analysis. Oakandnine removes that delay by unifying master data across departments from the outset, so the inputs a cost-to-serve model needs, financial, operational, transactional and customer data, are already aligned rather than reconciled by hand each cycle. Preemptive alerts flag cost drivers shifting in real time, which means pricing and service-tier decisions get made before a quarter closes rather than after the damage shows up in the numbers.
If your last cost-to-serve exercise is gathering dust in a shared drive, it is worth seeing what Oak & Nine's platform for operations leaders looks like connected to your own systems. Book a working session to map where your data currently sits and what a live model would take to build.
Sources
- Gartner: Supply chain leaders should implement a cost-to-serve model
- Deloitte: Cost to serve (advisory report)
- Academic industry study on cost allocation and customer profitability (DePaul repository)
- IMD: The hidden cost of cost-to-serve